

HOT TOPICS LIST
- MACD
- Fibonacci
- RSI
- Gann
- ADXR
- Stochastics
- Volume
- Triangles
- Futures
- Cycles
- Volatility
- ZIGZAG
- MESA
- Retracement
- Aroon
INDICATORS LIST
LIST OF TOPICS
PRINT THIS ARTICLE
by Stella Osoba, CMT
Traders use bands around price to help them determine when the price has strayed too far away from their average, either up or down. The construction of trading bands is relatively simple. Bands are placed above and below an average often using a fixed percentage. These bands can also be called envelopes. Bollinger Bands are one of the more popular types of trading bands.
Position: N/A
Stella Osoba, CMT
Stella Osoba is a trader and financial writer. She is a frequent contributor to "Technical Analysis of Stocks and Commodities" magazine and "Traders.com Advantage" as well as other financial publications.
PRINT THIS ARTICLE
BOLLINGER BANDS
Bollinger Bands And Volatility Signals
01/02/15 02:48:08 PMby Stella Osoba, CMT
Traders use bands around price to help them determine when the price has strayed too far away from their average, either up or down. The construction of trading bands is relatively simple. Bands are placed above and below an average often using a fixed percentage. These bands can also be called envelopes. Bollinger Bands are one of the more popular types of trading bands.
Position: N/A
| Bollinger Bands were created by John Bollinger in 1983 who determined that volatility was key to creating a more useful type of envelope around price. Bollinger Bands are composed of two bands, an upper and a lower around a measure of central tendency or an average. John Bollinger used a 20-day simple moving average (SMA) in its construction because 20 days approximated the number of trading days in a month. The bands above and below the 20 day SMA are + and - 2 standard deviations. This means that unlike the percentage bands which are at fixed percentages above and below their moving averages, Bollinger Bands contract and expand according to the volatility of the security in question. |
|
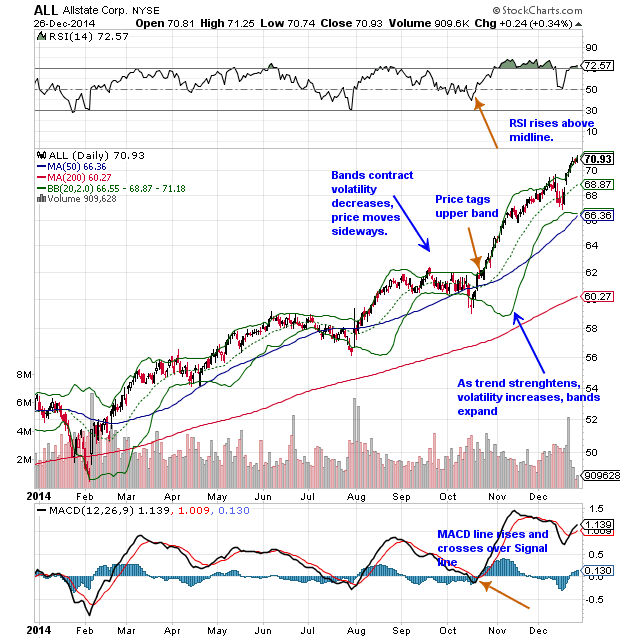
| Figure 1. Bollinger Bands. During strong trends, a period of increased volatility will result, causing the bands to separate from each other. As the bands begin to contract, it often means that leg of the trend is at an end. |
| Graphic provided by: StockCharts.com. |
| |
| John Bollinger has said that volatility is the key to Bollinger Bands because "high volatility begets low volatility and vice versa." The bands around price expand as volatility expands and contract as volatility contracts. A period of high volatility will eventually lead to a period of low volatility and vice versa, as is shown in Figure 1. Often during a strong trend, a period of increased volatility will result, causing the bands to separate from each other dramatically. As the bands turn back toward each other and begin to contract, it often means that leg of the trend is at an end. This is useful information which can help with making correct trading decisions. |
| Traders will often look for a tag of the band to make a decision involving the statistical concept known as regression to the mean. John Bollinger has warned that because regression to the mean is not as strong in financial markets as it is in other natural phenomenon, tags of the bands should not be taken as automatic buy or sell signals. For example, when price tags the upper band as it does on Figure 1 in October 2014, this is not a signal to go short and expect a regression to the mean or the moving average. Look for confirmation in other indicators to determine if the tag is either a continuation of the trend or an end of the trend. |
| In October 2014, we can see that when price tags the upper band, the relative strength index (RSI) and the moving average convergence/divergence (MACD) confirm the move. RSI is above 50 and rising. The MACD line is above the signal line and rising. The MACD and signal line are above the zero line. This confirmation by the indicators of the price tag means, according to John Bollinger, that you do not have a signal indicating regression to the mean. On the contrary you have a confirmation signal. Therefore, expect the trend to continue. Only if the price tag is unconfirmed by your indicators, should you expect a tag of the band to result in a price reversal and consequently a regression to the mean or the moving average. |
Stella Osoba is a trader and financial writer. She is a frequent contributor to "Technical Analysis of Stocks and Commodities" magazine and "Traders.com Advantage" as well as other financial publications.
| E-mail address: | stellaosoba@gmail.com |
Click here for more information about our publications!
Comments

Request Information From Our Sponsors
- StockCharts.com, Inc.
- Candle Patterns
- Candlestick Charting Explained
- Intermarket Technical Analysis
- John Murphy on Chart Analysis
- John Murphy's Chart Pattern Recognition
- John Murphy's Market Message
- MurphyExplainsMarketAnalysis-Intermarket Analysis
- MurphyExplainsMarketAnalysis-Visual Analysis
- StockCharts.com
- Technical Analysis of the Financial Markets
- The Visual Investor
- VectorVest, Inc.
- Executive Premier Workshop
- One-Day Options Course
- OptionsPro
- Retirement Income Workshop
- Sure-Fire Trading Systems (VectorVest, Inc.)
- Trading as a Business Workshop
- VectorVest 7 EOD
- VectorVest 7 RealTime/IntraDay
- VectorVest AutoTester
- VectorVest Educational Services
- VectorVest OnLine
- VectorVest Options Analyzer
- VectorVest ProGraphics v6.0
- VectorVest ProTrader 7
- VectorVest RealTime Derby Tool
- VectorVest Simulator
- VectorVest Variator
- VectorVest Watchdog