HOT TOPICS LIST
- MACD
- Fibonacci
- RSI
- Gann
- ADXR
- Stochastics
- Volume
- Triangles
- Futures
- Cycles
- Volatility
- ZIGZAG
- MESA
- Retracement
- Aroon
INDICATORS LIST
LIST OF TOPICS
PRINT THIS ARTICLE
by Koos van der Merwe
The US dollar is strong, which is one of the many reasons gold has fallen.
Position: Accumulate
Koos van der Merwe
Has been a technical analyst since 1969, and has worked as a futures and options trader with First Financial Futures in Johannesburg, South Africa.
PRINT THIS ARTICLE
ELLIOTT WAVE
Is Gold A Buy Now?
12/31/14 12:26:05 PMby Koos van der Merwe
The US dollar is strong, which is one of the many reasons gold has fallen.
Position: Accumulate
| A strong US dollar deters investors from buying gold shares, but with the probability that interest rates in the United States may start rising early in 2015, the US dollar will start falling, giving foreign investors a better buy value for gold and gold shares. So, when do you start buying shares or gold ETFs? Let's see what the charts tell us. |

|
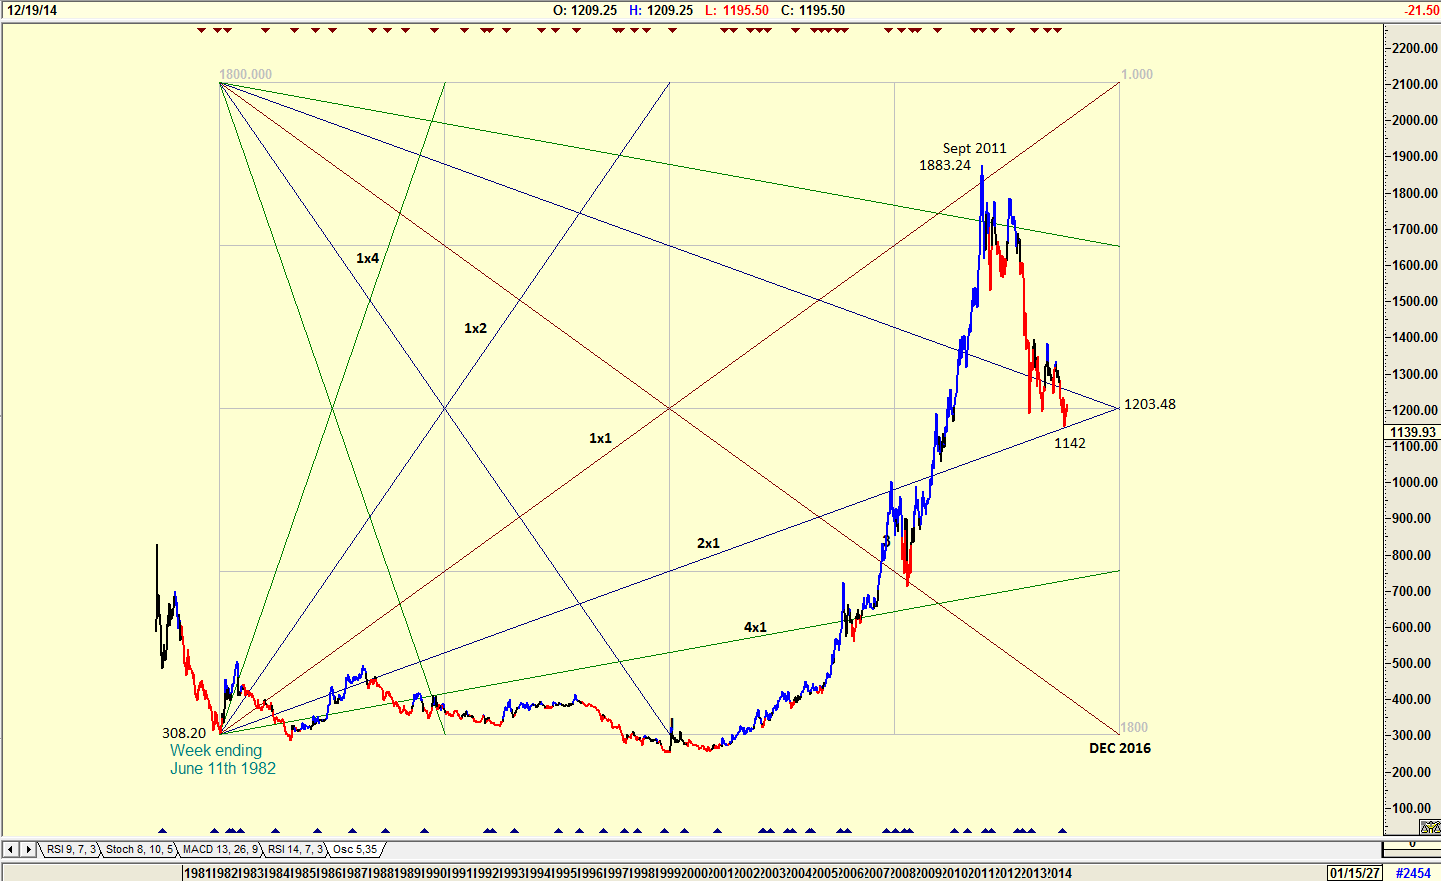
| Figure 1. Gann Squares. Here you see the weekly chart of London gold price with the Gann square overlaid on the price chart. |
| Graphic provided by: AdvancedGET. |
| |
| The chart in Figure 1 is a weekly chart of the London gold price with a Gann square overlaid on it. The chart shows how the price of gold rose from $308.20 the week ending June 11, 1982 to a high of $1883.24 by September 2011 finding resistance on the 1x1 line. The chart then shows how the price dropped to the 50% level of the Gann square at $1203.48. After finding support at the 50% line, it fell through it finding support on the the 2x1 line at $1142. The question is, will this support hold or will the gold price fall to the 4x1 line? |

|
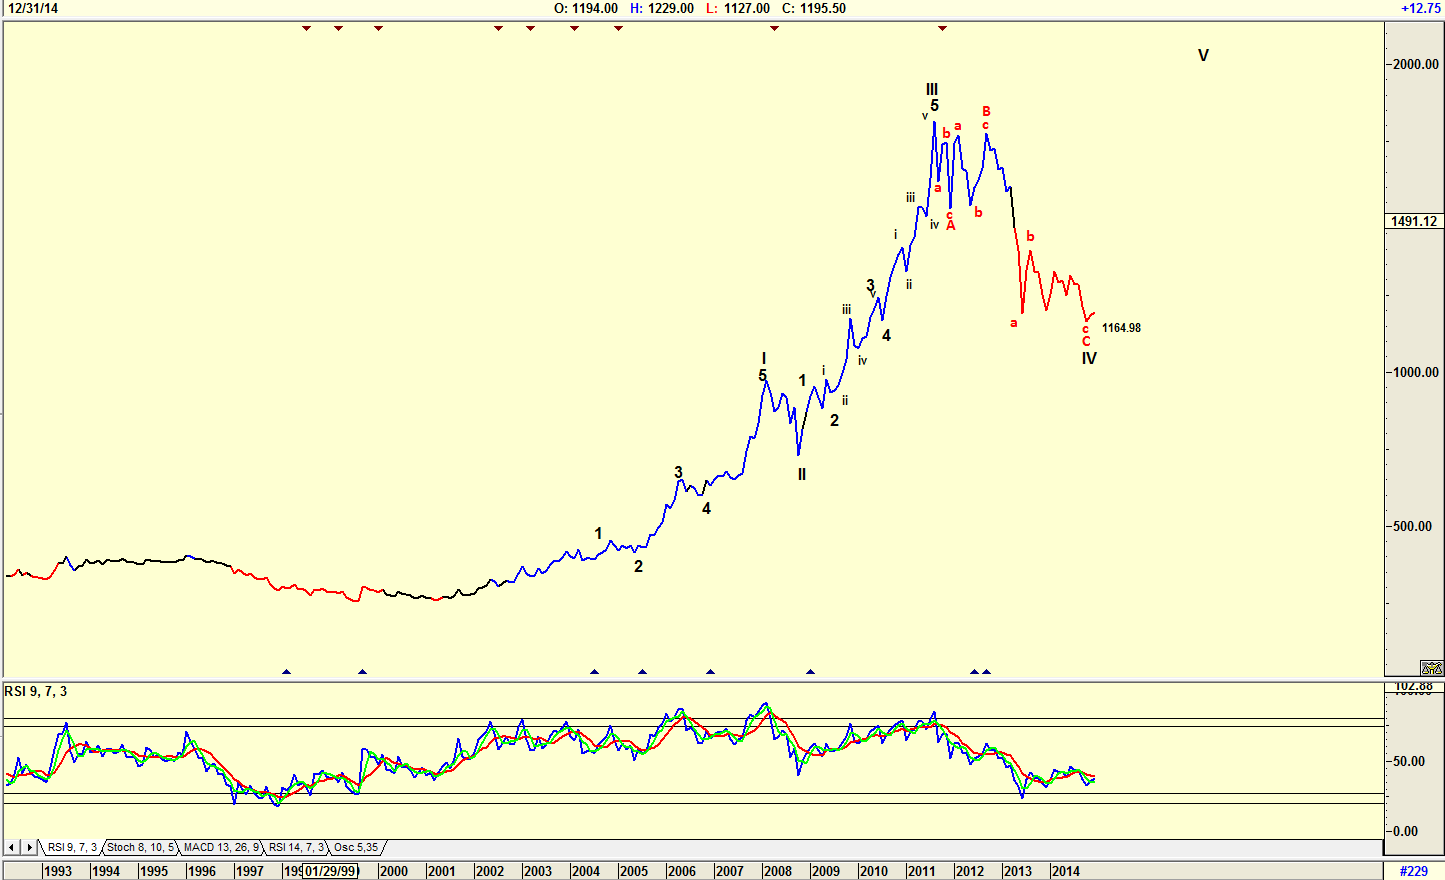
| Figure 2. Weekly chart of London gold price with Elliott Wave count. |
| Graphic provided by: AdvancedGET. |
| |
| The chart in Figure 2 is a monthly chart of the London gold price with an Elliott wave count suggesting that a WAVE IV correction is complete, and that the gold price should start moving upwards into WAVE V. This is confirmed by the relative strength index (RSI) which has given a buy signal. However, looking back to 1996, you can see where the RSI gave a buy signal, rose, and then gave a second even a third buy signal. This could happen again suggesting that the price of gold would possibly form a strong foundation before rising into a WAVE V. |

|
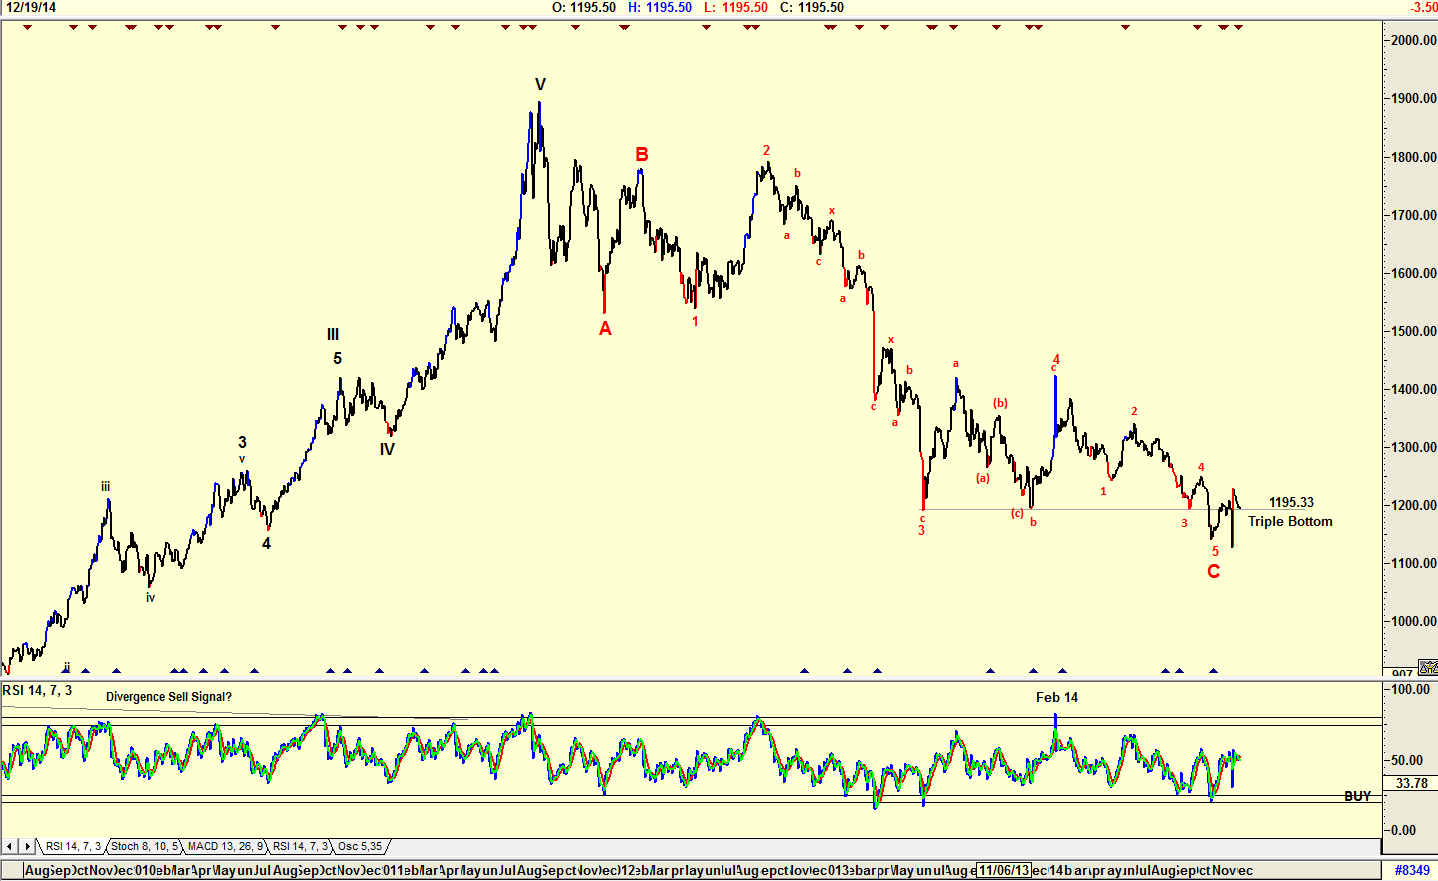
| Figure 3. Daily chart of the London gold Price with Elliott Wave count. |
| Graphic provided by: AdvancedGET. |
| |
| The chart in Figure 3 is a daily chart showing a complicated Elliott wave retracement into WAVE C. Note the triple bottom that formed at the $1195.33 level, and how the gold price fell through the triple bottom support line, recovered, then fell dramatically through it a second time and recovered strongly. The chart suggests that the gold price could be finding support on the triple bottom horizontal line once again. The RSI has given a definite buy signal. |

|
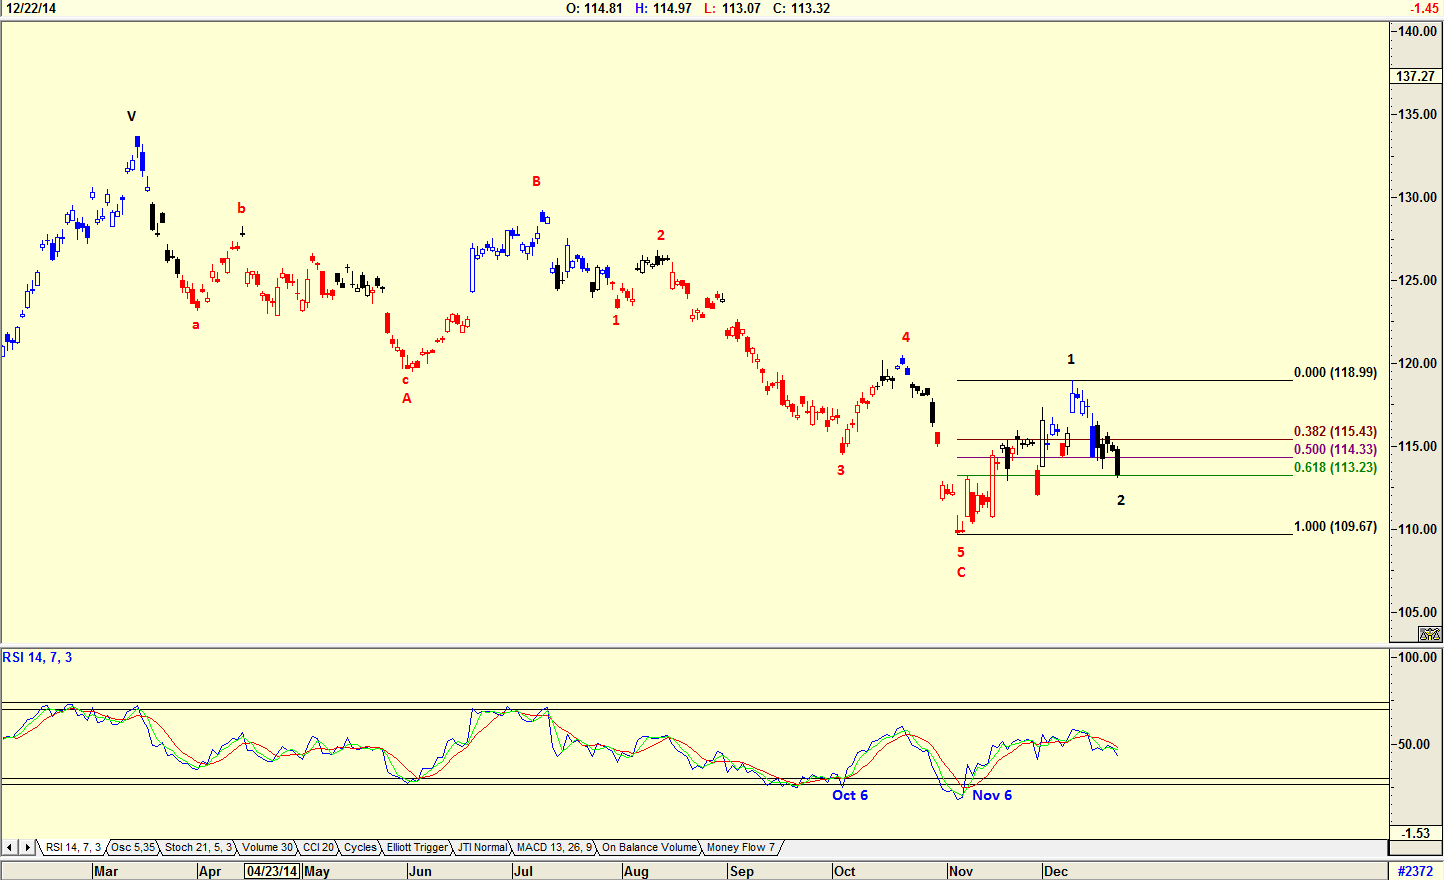
| Figure 4. Daily chart of the StreetTRACKS Gold EGF. |
| Graphic provided by: AdvancedGET. |
| |
| The chart in Figure 4 is a daily chart of StreetTRACKS Gold (GLD) ETF. The Elliott Wave count on the chart suggests that a Wave C is complete, that the ETF then rose in a Wave 1, and corrected to a 61.8% Fibonacci retracement level, suggesting that Wave 2 could have bottomed. The RSI gave a buy signal on November 6, 2014. However the chart shows that it also gave a buy signal a month earlier, on October 6, 2014. Would I be a strong buyer of gold at the moment? No, but I would start accumulating Gold ETFs slowly over the next few months, betting on interest rates in the United States rising in 2015, making the purchase of gold more attractive. |
Has been a technical analyst since 1969, and has worked as a futures and options trader with First Financial Futures in Johannesburg, South Africa.
| Address: | 3256 West 24th Ave |
| Vancouver, BC | |
| Phone # for sales: | 6042634214 |
| E-mail address: | petroosp@gmail.com |
Click here for more information about our publications!
Comments
Date: 01/02/15Rank: 5Comment:
Date: 01/20/15Rank: 5Comment:

Request Information From Our Sponsors
- StockCharts.com, Inc.
- Candle Patterns
- Candlestick Charting Explained
- Intermarket Technical Analysis
- John Murphy on Chart Analysis
- John Murphy's Chart Pattern Recognition
- John Murphy's Market Message
- MurphyExplainsMarketAnalysis-Intermarket Analysis
- MurphyExplainsMarketAnalysis-Visual Analysis
- StockCharts.com
- Technical Analysis of the Financial Markets
- The Visual Investor
- VectorVest, Inc.
- Executive Premier Workshop
- One-Day Options Course
- OptionsPro
- Retirement Income Workshop
- Sure-Fire Trading Systems (VectorVest, Inc.)
- Trading as a Business Workshop
- VectorVest 7 EOD
- VectorVest 7 RealTime/IntraDay
- VectorVest AutoTester
- VectorVest Educational Services
- VectorVest OnLine
- VectorVest Options Analyzer
- VectorVest ProGraphics v6.0
- VectorVest ProTrader 7
- VectorVest RealTime Derby Tool
- VectorVest Simulator
- VectorVest Variator
- VectorVest Watchdog
