HOT TOPICS LIST
- MACD
- Fibonacci
- RSI
- Gann
- ADXR
- Stochastics
- Volume
- Triangles
- Futures
- Cycles
- Volatility
- ZIGZAG
- MESA
- Retracement
- Aroon
INDICATORS LIST
LIST OF TOPICS
PRINT THIS ARTICLE
by Matt Blackman
Crude oil prices have dropped 50% since June. Is the worst over or is there more downside to come?
Position: N/A
Matt Blackman
Matt Blackman is a full-time technical and financial writer and trader. He produces corporate and financial newsletters, and assists clients in getting published in the mainstream media. He is the host of TradeSystemGuru.com. Matt has earned the Chartered Market Technician (CMT) designation. Find out what stocks and futures Matt is watching on Twitter at www.twitter.com/RatioTrade
PRINT THIS ARTICLE
CORRELATION ANALYSIS
Oily Slope Near An End?
12/29/14 05:10:59 PMby Matt Blackman
Crude oil prices have dropped 50% since June. Is the worst over or is there more downside to come?
Position: N/A
| Theories as to why energy prices have fallen off a cliff abound, ranging from falling demand in China due to a weakening economy to a conspiracy by western nations and Saudi Arabia to punish Vladimir Putin for his aggression in the Ukraine. But that oil prices have been cut in half in the last six months has generated significant impact — some positive and some negative — on the global economy. The biggest question now is what's next? |

|
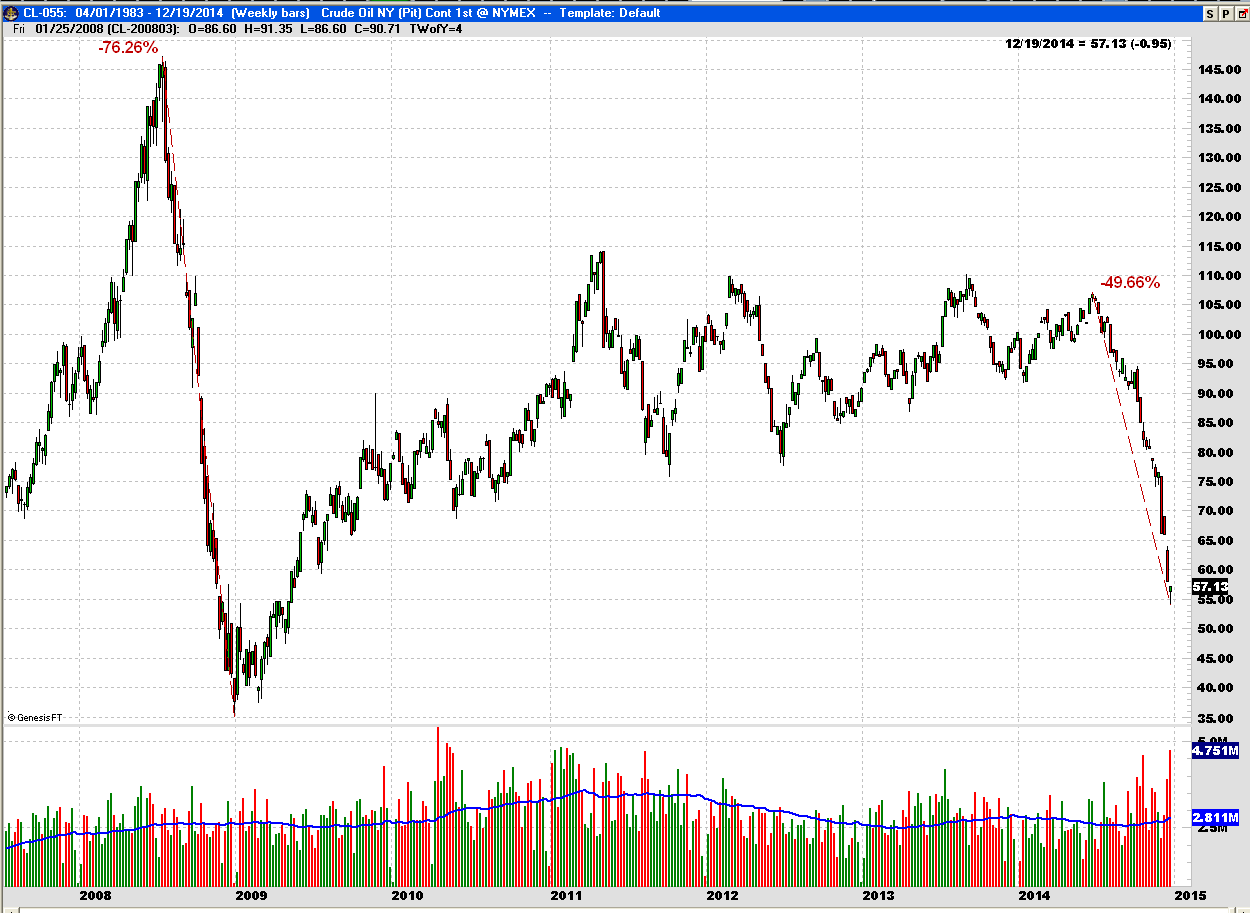
| Figure 1. Weekly Chart Of West Texas Intermediate oil. West Texas Intermediate oil hit a 2014 high of $107.68 in June before dropping 50% to a five year low of $53.60 on December 16, 2014. |
| Graphic provided by: Trade Navigator by http://www.tradenavigator.com/. |
| |
| As we see from Figure 1, this isn't the first time oil prices have fallen substantially. In 2008, they dropped more than 70% as the global economy reeled in the wake of the US housing and subprime meltdown. Given that the economy has not shown any signs (yet) of similar contagion, a drop in crude in the 70% range is unlikely. |

|
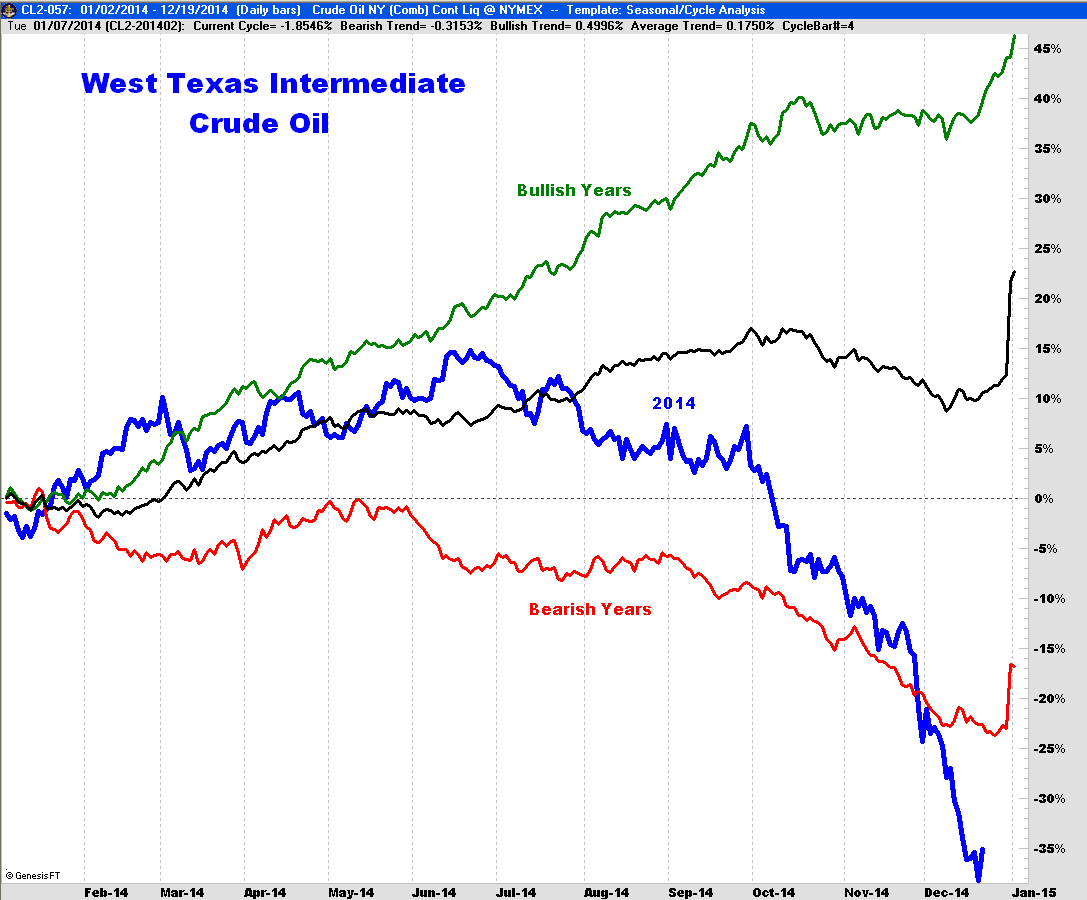
| Figure 2. Daily Chart Showing The Annual Seasonal Performance Of Crude Oil Since 1990. The green line is a composite of up years, the red a composite of down years, the black is average performance of the last 24 years and the blue is 2014 performance. |
| Graphic provided by: Trade Navigator by http://www.tradenavigator.com/. |
| |
| To get another perspective on the situation, it is worthwhile to look at seasonal performance. How does this current move compare to past years? As we see in Figure 2, 2014 has been an awful year for oil, only surpassed by 2008 when prices dropped further before rebounding. |
| So unless more data surfaces to show that the world is heading for a 2008-style meltdown, oil prices should be looking for a bottom around $53 and if that bottom holds, a base will take some time to form. If the downside has been overblown, we could even see a respectable upside bounce in 2015. But if $53 support is decisively breached all long bets are off! |

|
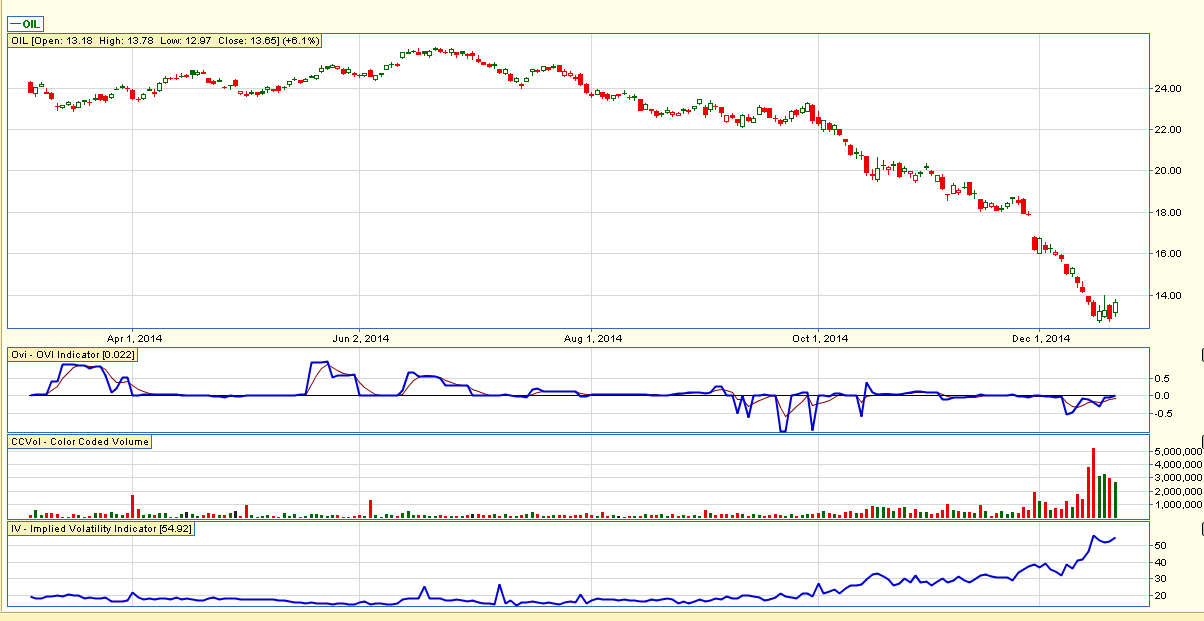
| Figure 3. Daily Chart Of The iPath S&P GSCI Crude Oil Total Return Index ETN (OIL). OIL experienced a 50% drop since late June. Implied volatility reached the highest level since October 3, 2011 when OIL was trading around $19.50. By late February 2012, it had rallied to nearly $27.90. |
| Graphic provided by: http://www.ovitradersclub.com/. |
| |
| For those looking to exploit the crude move in a stock, the iPath S&P GSCI Crude Oil Total Return Index ETN (OIL) is a good way to play it. As you see from Figure 3, OIL is also off 50% since June and looks to be searching for a bottom. |
Matt Blackman is a full-time technical and financial writer and trader. He produces corporate and financial newsletters, and assists clients in getting published in the mainstream media. He is the host of TradeSystemGuru.com. Matt has earned the Chartered Market Technician (CMT) designation. Find out what stocks and futures Matt is watching on Twitter at www.twitter.com/RatioTrade
| Company: | TradeSystemGuru.com |
| Address: | Box 2589 |
| Garibaldi Highlands, BC Canada | |
| Phone # for sales: | 604-898-9069 |
| Fax: | 604-898-9069 |
| Website: | www.tradesystemguru.com |
| E-mail address: | indextradermb@gmail.com |
Traders' Resource Links | |
| TradeSystemGuru.com has not added any product or service information to TRADERS' RESOURCE. | |
Click here for more information about our publications!
Comments

Request Information From Our Sponsors
- StockCharts.com, Inc.
- Candle Patterns
- Candlestick Charting Explained
- Intermarket Technical Analysis
- John Murphy on Chart Analysis
- John Murphy's Chart Pattern Recognition
- John Murphy's Market Message
- MurphyExplainsMarketAnalysis-Intermarket Analysis
- MurphyExplainsMarketAnalysis-Visual Analysis
- StockCharts.com
- Technical Analysis of the Financial Markets
- The Visual Investor
- VectorVest, Inc.
- Executive Premier Workshop
- One-Day Options Course
- OptionsPro
- Retirement Income Workshop
- Sure-Fire Trading Systems (VectorVest, Inc.)
- Trading as a Business Workshop
- VectorVest 7 EOD
- VectorVest 7 RealTime/IntraDay
- VectorVest AutoTester
- VectorVest Educational Services
- VectorVest OnLine
- VectorVest Options Analyzer
- VectorVest ProGraphics v6.0
- VectorVest ProTrader 7
- VectorVest RealTime Derby Tool
- VectorVest Simulator
- VectorVest Variator
- VectorVest Watchdog
