

HOT TOPICS LIST
- MACD
- Fibonacci
- RSI
- Gann
- ADXR
- Stochastics
- Volume
- Triangles
- Futures
- Cycles
- Volatility
- ZIGZAG
- MESA
- Retracement
- Aroon
INDICATORS LIST
LIST OF TOPICS
PRINT THIS ARTICLE
by Donald W. Pendergast, Jr.
Shares of Electronic Arts, Inc. are up by more than 52% in the past nine weeks, with even more upside possible before a reversal.
Position: N/A
Donald W. Pendergast, Jr.
Freelance financial markets writer and online publisher of the Trendzetterz.com S&P 500 Weekly Forecast service.
PRINT THIS ARTICLE
CYCLES
EA: Still Powering Higher
12/29/14 05:07:45 PMby Donald W. Pendergast, Jr.
Shares of Electronic Arts, Inc. are up by more than 52% in the past nine weeks, with even more upside possible before a reversal.
Position: N/A
| Despite the gloom and doom pronouncements of the perma-bears of the financial world, the S&P 500 index (.SPX) still looks to be in healthy technical condition, with a new high possible in early 2015. One of the best performing .SPX components since the major October 15, 2014 lows have been shares of Electronic Arts, Inc. (EA), which also has favorable price cycle dynamics working in its favor. Here's a closer look at EA now along with some cycle timing ideas. |
|
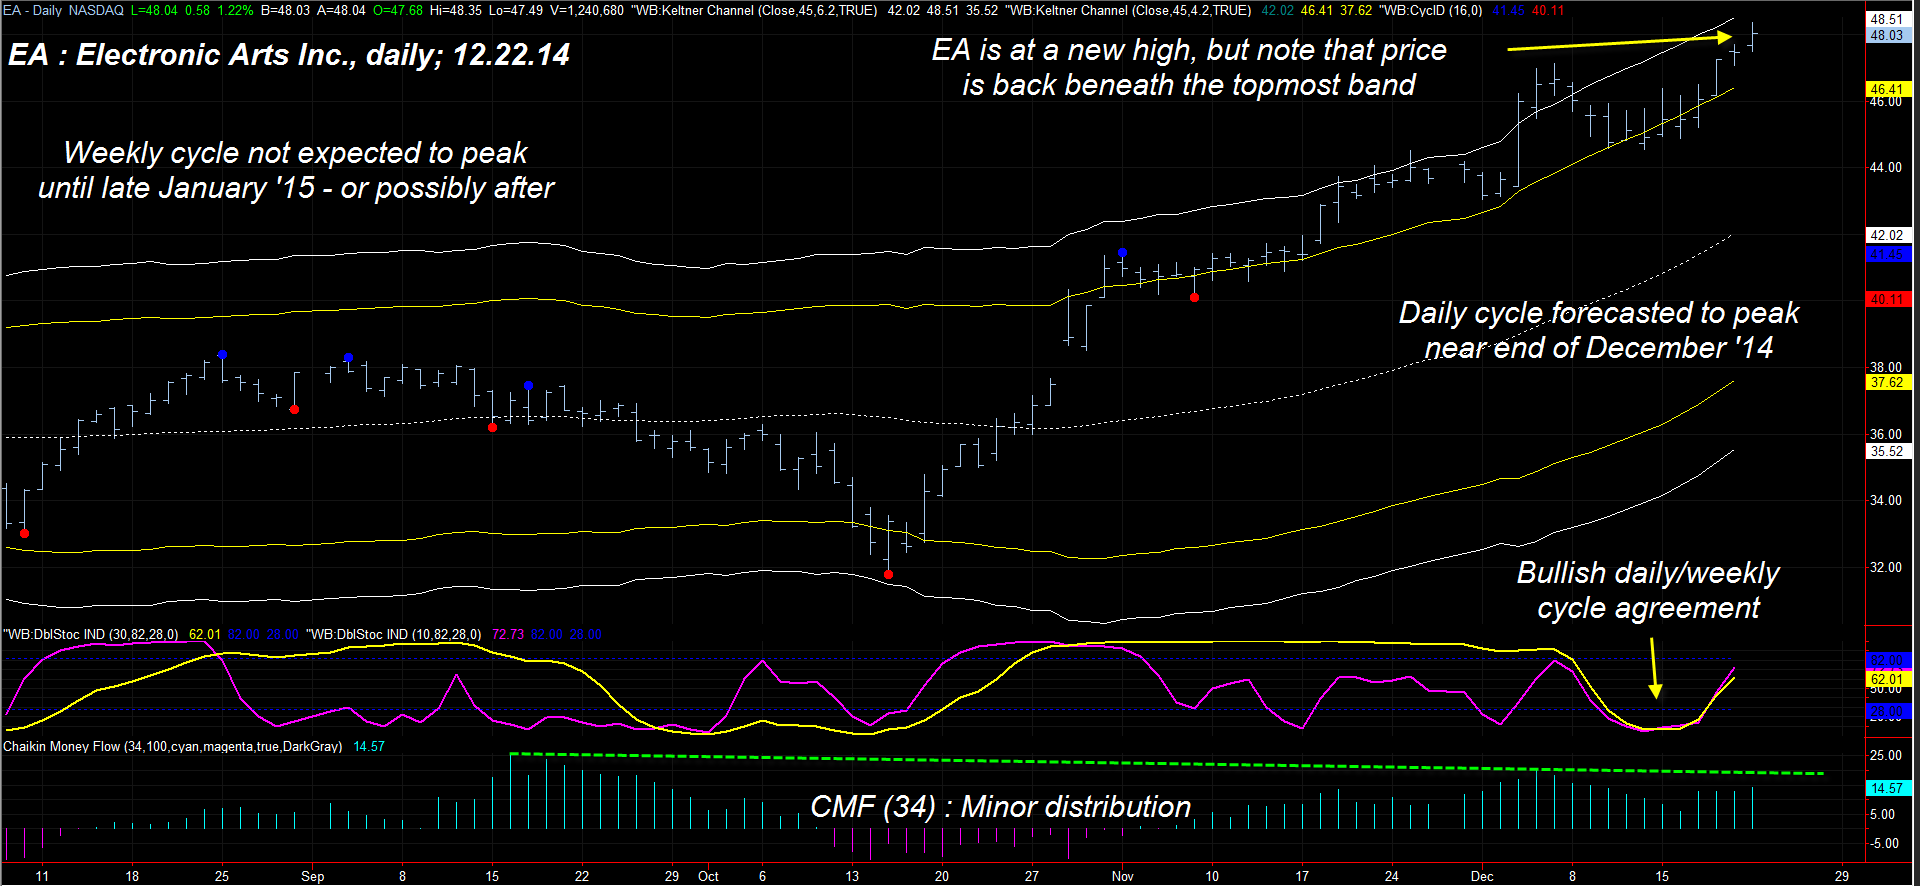
| Figure 1. Daily Chart Of Electronic Arts. Electronic Arts, Inc. (EA) has bullish price cycle dynamics at work that could cause it to see even higher prices in early 2015. Signs of bearish divergence are beginning to manifest, however, making trade management of utmost importance. |
| Graphic provided by: TradeStation. |
| Graphic provided by: ProfitTrader7 from www.walterbressert.com. |
| |
| One of the really useful aspects of trading with price cycles centers on its practical application to trend following methodologies. For example, if you see that the weekly cycle in a stock has made an important bottom at a key chart support level and that the subsequent price action is bullish, you can use that information to help you stay in your long positions initiated on the daily time frame for a much longer length of time. For example, in the chart in Figure 1, notice that the weekly cycle oscillator (yellow) and the daily cycle oscillator (magenta) bottomed simultaneously around December 15, 2015; if you normally swing trade off a daily time frame chart, this would have alerted you that there was a good chance that a more sustained upswing was possible because the weekly and daily timeframe cycle lows were very much in sync. Then when you saw both cycles turn rapidly higher together, you had even more reason to run a wider trailing stop, seeking to get as much out of the move as possible. Even better, by measuring historical cycle lengths for both the weekly and daily charts, you could even create a high probability time/price forecast for the topping zone of the upswing. In the case of EA, the current up thrust is not expected to peak until at least December 31, 2014 (based on daily cycles), while the weekly cycle is not anticipated to top until the latter half of January 2015 — which is the most conservative forecast. With this knowledge, a trader currently long EA since mid-December 2014 might anticipate taking half their open gains near the end of this month, while letting the other half of the position run as long as possible, using a trailing stop to manage the trade on the weekly chart. |
|
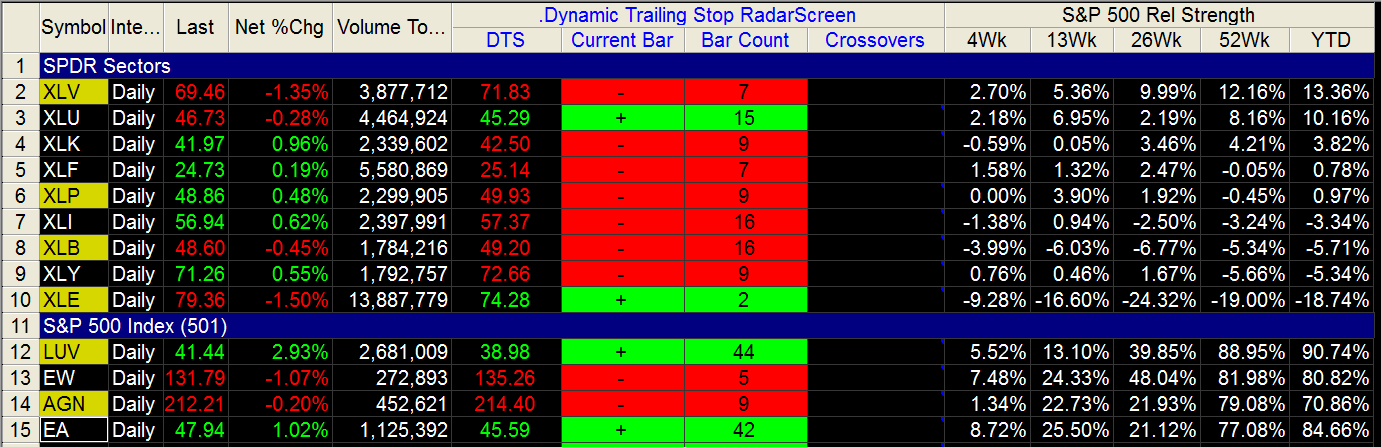
| Figure 2. Relative Performance. EA remains one of the strongest stocks in the S&P 500 index (.SPX) as 2014 draws to a close. |
| Graphic provided by: TradeStation. |
| Graphic provided by: TradeStation RadarScreen and Fibozachi.com. |
| |
| Of course, there are other technical factors to consider for EA: 1. The stock poked above the extreme upper Keltner band in early December 2014, closed back below it, and has now gone on to make a new high — but this time beneath the top band. This is frequently an early warning sign of an impending reversal and/or period of consolidation. 2. The 34-day Chaikin money flow (CMF) (34), although still positive, is suggesting a modest amount of distribution is underway. The 89-day (CMF)(89) histogram is confirming the same dynamic; this is normal as a major trend matures, and is a necessary precursor to the eventual correction or consolidation after the next major cycle high is achieved. Existing longs should attempt to ride the bullish weekly cycle as far as possible, while still being careful to take some profits should this current daily swing move higher into next week. EA has very strong comparative relative strength vs. the .SPX and that also bodes well for the weekly cycle to grind higher well into January 2015. Trade wisely until we meet here again. |
Freelance financial markets writer and online publisher of the Trendzetterz.com S&P 500 Weekly Forecast service.
| Title: | Market consultant and writer |
| Company: | Trendzetterz |
| Address: | 81 Hickory Hollow Drive |
| Crossville, TN 38555 | |
| Phone # for sales: | 904-303-4814 |
| Website: | trendzetterz.com |
| E-mail address: | support@trendzetterz.com |
Traders' Resource Links | |
| Trendzetterz has not added any product or service information to TRADERS' RESOURCE. | |
Click here for more information about our publications!
PRINT THIS ARTICLE

Request Information From Our Sponsors
- StockCharts.com, Inc.
- Candle Patterns
- Candlestick Charting Explained
- Intermarket Technical Analysis
- John Murphy on Chart Analysis
- John Murphy's Chart Pattern Recognition
- John Murphy's Market Message
- MurphyExplainsMarketAnalysis-Intermarket Analysis
- MurphyExplainsMarketAnalysis-Visual Analysis
- StockCharts.com
- Technical Analysis of the Financial Markets
- The Visual Investor
- VectorVest, Inc.
- Executive Premier Workshop
- One-Day Options Course
- OptionsPro
- Retirement Income Workshop
- Sure-Fire Trading Systems (VectorVest, Inc.)
- Trading as a Business Workshop
- VectorVest 7 EOD
- VectorVest 7 RealTime/IntraDay
- VectorVest AutoTester
- VectorVest Educational Services
- VectorVest OnLine
- VectorVest Options Analyzer
- VectorVest ProGraphics v6.0
- VectorVest ProTrader 7
- VectorVest RealTime Derby Tool
- VectorVest Simulator
- VectorVest Variator
- VectorVest Watchdog