HOT TOPICS LIST
- MACD
- Fibonacci
- RSI
- Gann
- ADXR
- Stochastics
- Volume
- Triangles
- Futures
- Cycles
- Volatility
- ZIGZAG
- MESA
- Retracement
- Aroon
INDICATORS LIST
LIST OF TOPICS
PRINT THIS ARTICLE
by Stella Osoba, CMT
The VIX is a volatility index registered by the Chicago Board Options Exchange (CBOE) which has come to be known in the popular press as the fear index or the fear gauge.
Position: N/A
Stella Osoba, CMT
Stella Osoba is a trader and financial writer. She is a frequent contributor to "Technical Analysis of Stocks and Commodities" magazine and "Traders.com Advantage" as well as other financial publications.
PRINT THIS ARTICLE
VOLATILITY
The Fear Index Or The VIX
12/23/14 03:56:29 PMby Stella Osoba, CMT
The VIX is a volatility index registered by the Chicago Board Options Exchange (CBOE) which has come to be known in the popular press as the fear index or the fear gauge.
Position: N/A
| The VIX was launched in 1993 by the Chicago Board Options Exchange (CBOE). It measures expected market volatility over a one month rolling period using a basket of S&P 500 index (SPX) options prices. The index is calculated using near-term put and call options with more than 23 days and less than 37 days to expiration. The VIX uses an average of the weighted prices of these puts and calls over a range of strike prices to arrive at a number for expected volatility of the general market. Its calculation is complex and it will not be covered in this short article. Since its inception, the VIX has become the most widely followed volatility index on the market and can be used as a trading and a risk management tool. It means that traders can buy or sell stock market volatility by trading the VIX. |
| The VIX measures the expectations of traders' anticipation of volatility by the rise in the price of premiums paid for a basket of S&P 500 stock options. When traders expect the market to rise, they buy put options which causes their price to rise. This causes the VIX to also rise. When traders expect prices to fall, they sell options which causes them to become cheaper. The VIX then begins to fall. So really, the VIX is actually telling us whether options premiums are expensive or cheap. From this information we can deduce the opinions of market players about the expected volatility in the market or their sentiment. |
| The VIX is usually depicted in percentage terms. For example, a reading of 20 means that the VIX is forecasting a 20% volatility for at-the-money options in the next rolling thirty day period. Likewise, a reading of 40, which is high, says that the market is forecasting 40% volatility for at-the-money premiums. During market crashes, the VIX has moved to historic highs. For example in November 2008, when financial markets were in meltdown, the VIX spiked above 81. Conversely, during periods of stock market booms, when markets tend to rise among a sea of growing complacency, the VIX falls and has registered numbers in the very low double digits. Historically, a reading over 20 and rising is high and suggests fear is returning to the market and a reading under 20 and falling suggests that the market is forecasting a low risk environment. |
| Volatility is mean reverting which means that periods of high volatility will eventually be followed by periods of low volatility and vice versa. This is why it is possible to trade volatility by using the VIX. But remember, because markets can trend for extended periods of time, periods of low volatility can remain that way for long periods of time as can periods of high volatility. |

|
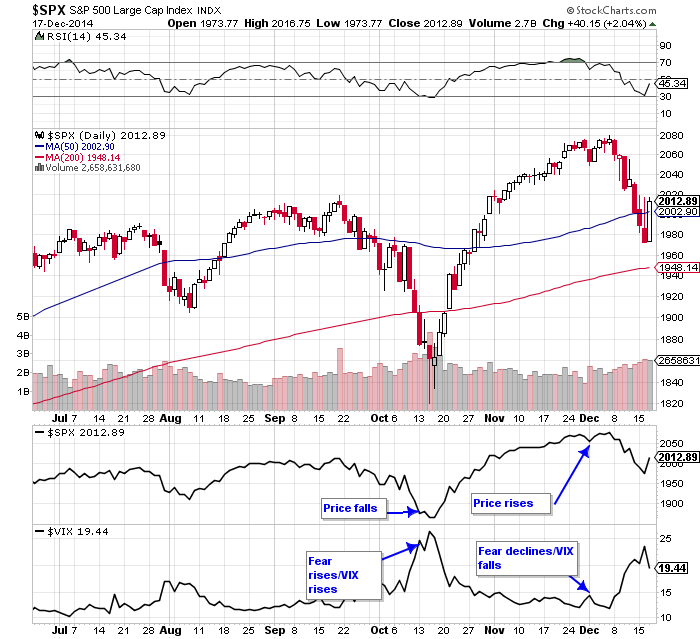
| Figure 1. The Volatility Index. When the S&P 500 fell in October, the VIX rose. The converse took place when the market rose. |
| Graphic provided by: StockCharts.com. |
| |
| The VIX is a contrarian indicator which means that it will usually do the inverse of what the market is doing. A good example of this can be seen in Figure 1. When the S&P 500 fell in October, the VIX rose. When the market subsequently rose in November and December, the VIX fell. |
Stella Osoba is a trader and financial writer. She is a frequent contributor to "Technical Analysis of Stocks and Commodities" magazine and "Traders.com Advantage" as well as other financial publications.
| E-mail address: | stellaosoba@gmail.com |
Click here for more information about our publications!
Comments

Request Information From Our Sponsors
- StockCharts.com, Inc.
- Candle Patterns
- Candlestick Charting Explained
- Intermarket Technical Analysis
- John Murphy on Chart Analysis
- John Murphy's Chart Pattern Recognition
- John Murphy's Market Message
- MurphyExplainsMarketAnalysis-Intermarket Analysis
- MurphyExplainsMarketAnalysis-Visual Analysis
- StockCharts.com
- Technical Analysis of the Financial Markets
- The Visual Investor
- VectorVest, Inc.
- Executive Premier Workshop
- One-Day Options Course
- OptionsPro
- Retirement Income Workshop
- Sure-Fire Trading Systems (VectorVest, Inc.)
- Trading as a Business Workshop
- VectorVest 7 EOD
- VectorVest 7 RealTime/IntraDay
- VectorVest AutoTester
- VectorVest Educational Services
- VectorVest OnLine
- VectorVest Options Analyzer
- VectorVest ProGraphics v6.0
- VectorVest ProTrader 7
- VectorVest RealTime Derby Tool
- VectorVest Simulator
- VectorVest Variator
- VectorVest Watchdog
