HOT TOPICS LIST
- MACD
- Fibonacci
- RSI
- Gann
- ADXR
- Stochastics
- Volume
- Triangles
- Futures
- Cycles
- Volatility
- ZIGZAG
- MESA
- Retracement
- Aroon
INDICATORS LIST
LIST OF TOPICS
PRINT THIS ARTICLE
by Koos van der Merwe
How high can the price of Apple stock go? That is the big question.
Position: Buy
Koos van der Merwe
Has been a technical analyst since 1969, and has worked as a futures and options trader with First Financial Futures in Johannesburg, South Africa.
PRINT THIS ARTICLE
TECHNICAL ANALYSIS
A Buy For Apple
12/19/14 05:11:06 PMby Koos van der Merwe
How high can the price of Apple stock go? That is the big question.
Position: Buy
| Sometime in January, Apple (AAPL) will be introducing and selling the Apple watch to the public. Is the market anticipating a 'sell-out' of the watch, or are Apple shares moving up because on December 10, 2014 the company announced that the iPad Air and iPad mini will be available in China? Or, is there something else up Apple's sleeve that is attracting investors? Whatever it is, does a look at the technicals suggest that AAPL is a buy? |

|
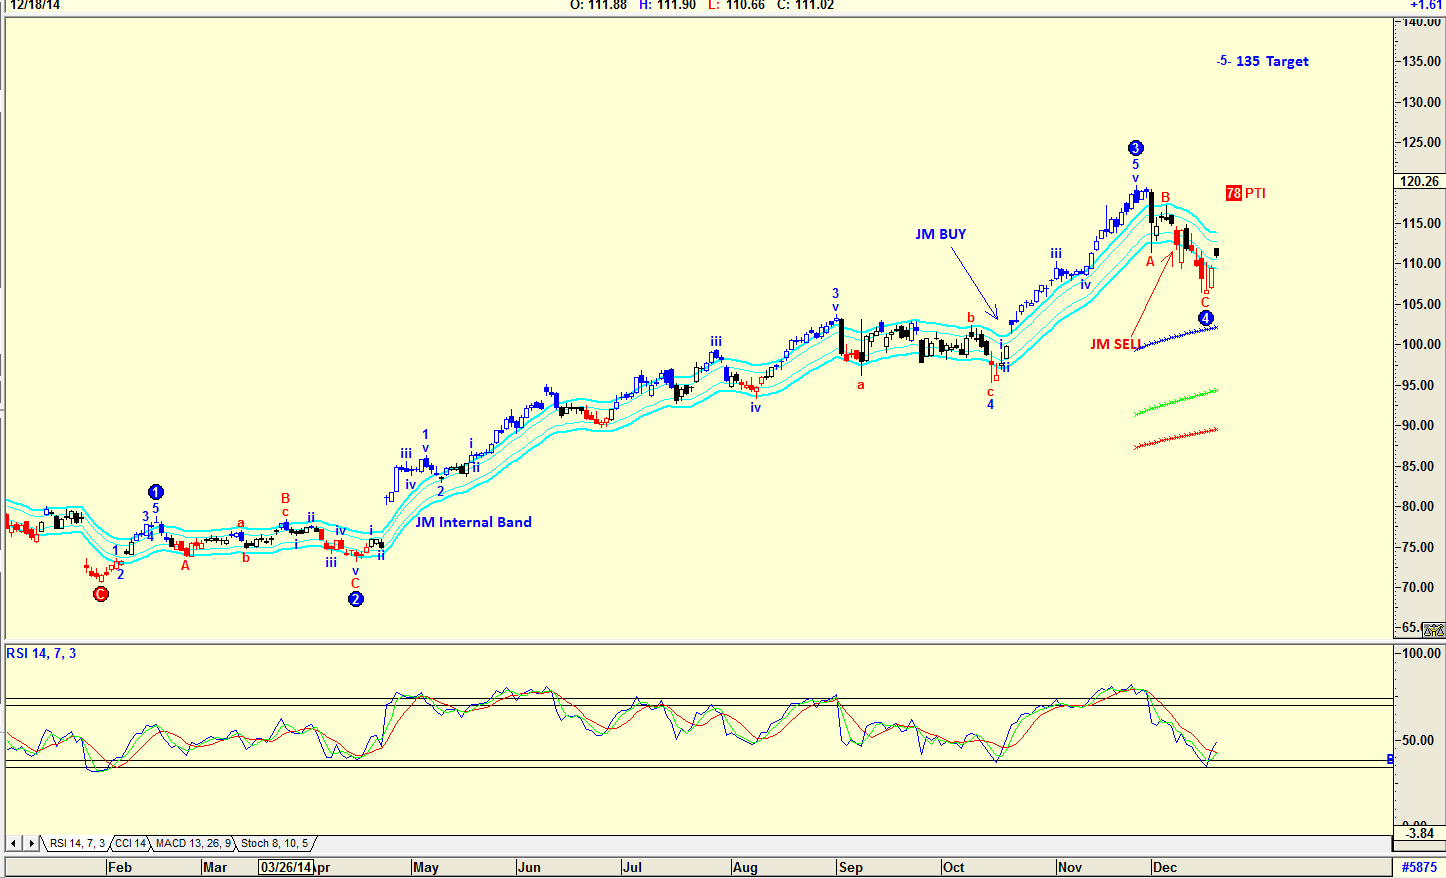
| Figure 1. Daily Chart With Elliott Wave Count. The price of Apple, Inc. (AAPL) appears to have completed a WAVE 4 correction and is now rising in a WAVE 5 with a suggested target of $135. |
| Graphic provided by: AdvancedGET. |
| |
| The daily chart in Figure 1 shows an Elliott Wave count suggesting that the share price has completed a WAVE 4 correction and is now rising in a WAVE 5 with a suggested target of $135. The probability index (PTI) at 78 is strong. The relative strength index (RSI) has also given a strong buy signal. The share price however, has not given a JM internal band buy signal. A JM internal band is a 15-period simple moving average offset by 2% positive and 2% negative. A buy signal is given when the share price breaks above the upper band and a sell signal is given when it breaks below the lower band. Note the color of the candlestick which is black. This is created by the expert trend locator (XTL) indicator, which uses statistical evaluation of the market to tell the difference between random market swings (noise) and directed market swings (trends). When the bar color is blue then the trend is up, if red, then the trend is down, and if it's black it's neutral. |

|
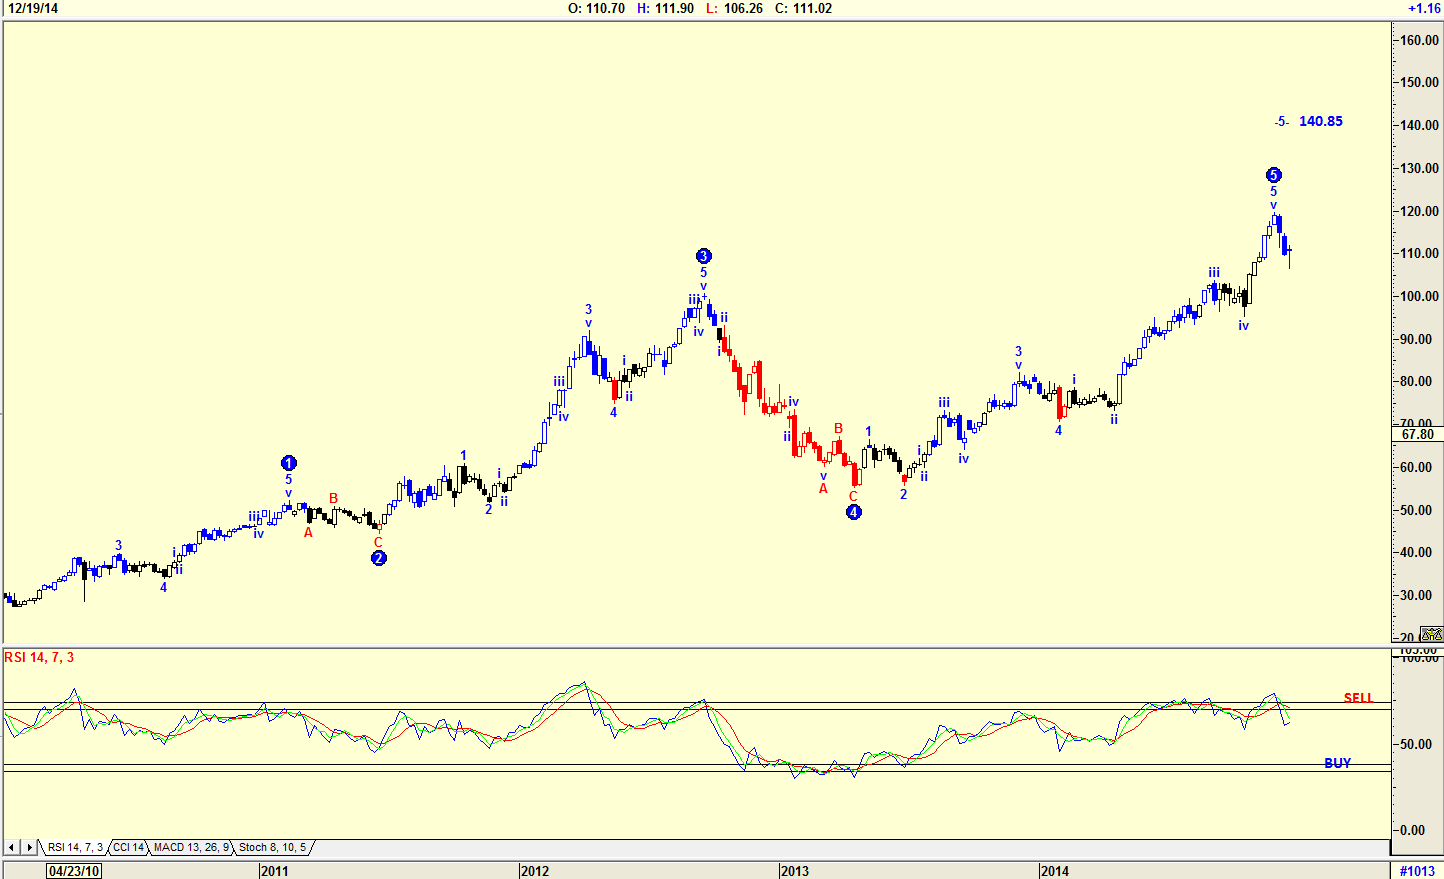
| Figure 2. Weekly Chart With Elliott Wave Count. Here it appears as if a WAVE 5 could be complete but the price could rise even further. |
| Graphic provided by: AdvancedGET. |
| |
| A weekly chart in Figure 2 has an Elliott Wave count suggesting that a WAVE 5 could be complete. However, the chart is also suggesting the possibility that the share price could rise to 140.85. The RSI is suggesting a sell signal but looking back at previous movement suggests that it could rise back above the 70 horizontal line and give a later sell signal. Note the color of the candlestick is blue, suggesting strength. |

|
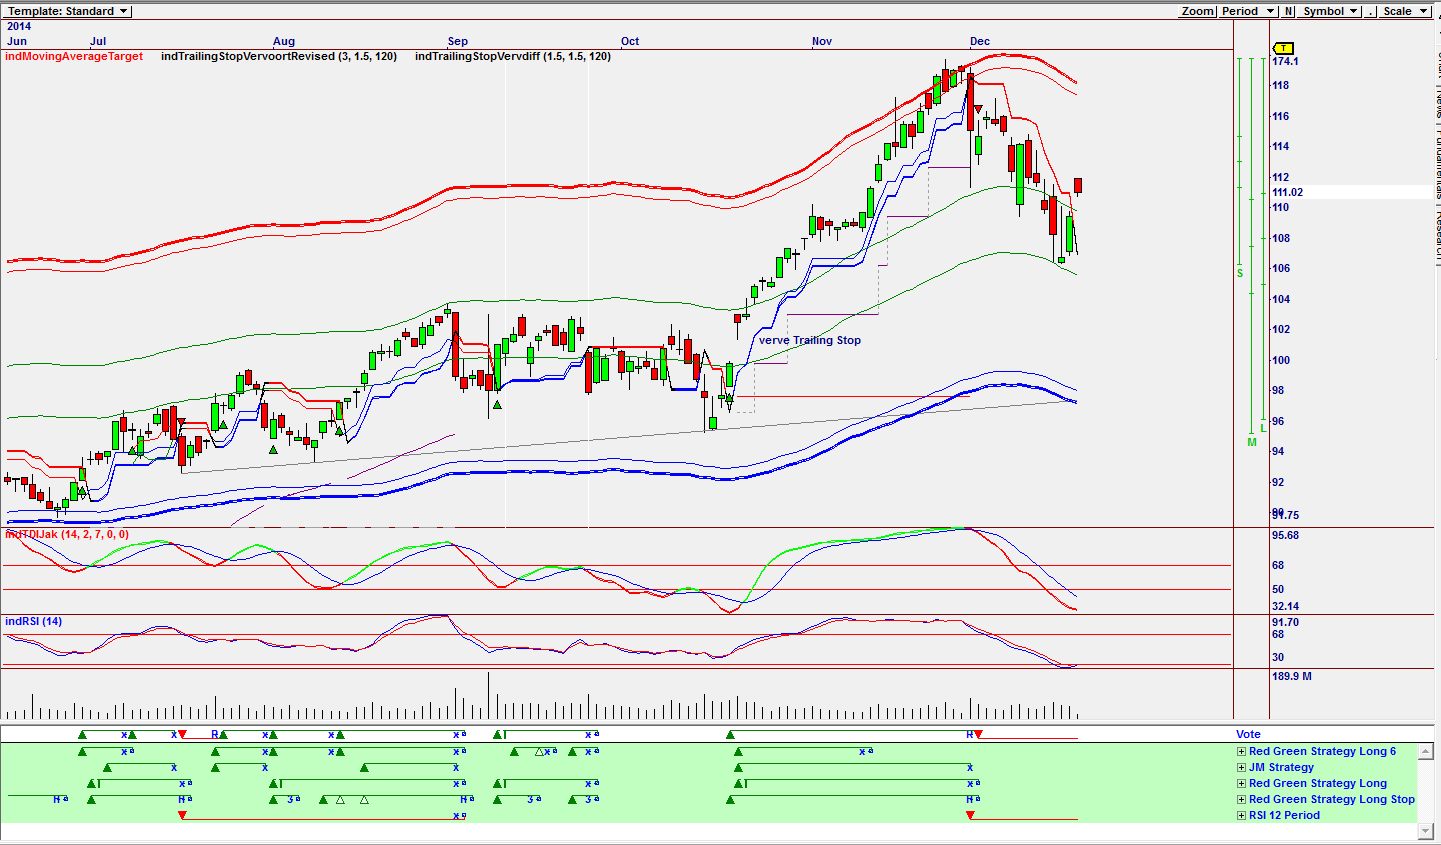
| Figure 3. Daily Chart With Vote Line. Here the chart suggests a sell signal. |
| Graphic provided by: Omnitrader. |
| |
| The daily Omnitrader chart in Figure 3 shows that the Vote line is still suggesting a sell signal based on the RSI 12-period strategy shown in green below the Vote line. Note the 14-period RSI has suggested a buy, but the TDIJak indicator is still moving down and has not given a buy signal. Also note that volume has been falling as the price has risen, which is a sign of weakness. Buying AAPL looks tempting, and if I were to buy at its present levels, I would keep my trailing stop close. The weekly chart and the chart in Figure 3, puts doubt in my mind. Caution prevails. |
Has been a technical analyst since 1969, and has worked as a futures and options trader with First Financial Futures in Johannesburg, South Africa.
| Address: | 3256 West 24th Ave |
| Vancouver, BC | |
| Phone # for sales: | 6042634214 |
| E-mail address: | petroosp@gmail.com |
Click here for more information about our publications!
Comments
Date: 01/04/15Rank: 5Comment:

Request Information From Our Sponsors
- VectorVest, Inc.
- Executive Premier Workshop
- One-Day Options Course
- OptionsPro
- Retirement Income Workshop
- Sure-Fire Trading Systems (VectorVest, Inc.)
- Trading as a Business Workshop
- VectorVest 7 EOD
- VectorVest 7 RealTime/IntraDay
- VectorVest AutoTester
- VectorVest Educational Services
- VectorVest OnLine
- VectorVest Options Analyzer
- VectorVest ProGraphics v6.0
- VectorVest ProTrader 7
- VectorVest RealTime Derby Tool
- VectorVest Simulator
- VectorVest Variator
- VectorVest Watchdog
- StockCharts.com, Inc.
- Candle Patterns
- Candlestick Charting Explained
- Intermarket Technical Analysis
- John Murphy on Chart Analysis
- John Murphy's Chart Pattern Recognition
- John Murphy's Market Message
- MurphyExplainsMarketAnalysis-Intermarket Analysis
- MurphyExplainsMarketAnalysis-Visual Analysis
- StockCharts.com
- Technical Analysis of the Financial Markets
- The Visual Investor
