

HOT TOPICS LIST
- MACD
- Fibonacci
- RSI
- Gann
- ADXR
- Stochastics
- Volume
- Triangles
- Futures
- Cycles
- Volatility
- ZIGZAG
- MESA
- Retracement
- Aroon
INDICATORS LIST
LIST OF TOPICS
PRINT THIS ARTICLE
by Stella Osoba, CMT
Markets do not always trend. Sometimes they are range bound and as a result the tools which will be most suitable for analysis in these types of market differ from those that are useful in a trending market. A popular tool that is helpful in determining whether we are in a trending or range bound market is the average directional movement index (ADX).
Position: N/A
Stella Osoba, CMT
Stella Osoba is a trader and financial writer. She is a frequent contributor to "Technical Analysis of Stocks and Commodities" magazine and "Traders.com Advantage" as well as other financial publications.
PRINT THIS ARTICLE
ADXR
Trading With The ADX
12/16/14 03:29:49 PMby Stella Osoba, CMT
Markets do not always trend. Sometimes they are range bound and as a result the tools which will be most suitable for analysis in these types of market differ from those that are useful in a trending market. A popular tool that is helpful in determining whether we are in a trending or range bound market is the average directional movement index (ADX).
Position: N/A
| The ADX was created by Welles Wilder. It's construction is rather complex and involved. I will attempt to simplify it here by sticking to essentials. The ADX is constructed from two indicators which are called directional movement indicators or DIs. A DI is obtained by calculating the maximum movement of price, up or down, over the required time period. For our purposes, I will say daily but it can be almost any other time period. Because, prices can go up as well as down, you have two DI's; a +DI and a -DI. The DI is calculated as an average over time to smooth the volatility. Default value is 14. |
| Once the -DI and the +DI's are calculated then the average of the two can also be plotted. This is known as the ADX. In its construction, the negative sign is ignored when the -DI has a greater reading than the +DI. Hence the resulting ADX can only tell you whether the security you are studying is experiencing directional movement and not the direction of that movement. The ADX is calculated to produce a number bounded between 0 to 100. High ADX numbers tells you that the security in question is experiencing a lot of directional movement or that it is in a strong trend, up or down. Low ADX readings tells us that the security is more likely to be range bound and not trending. |
| Use the ADX to determine whether you are in a trending or non trending environment. If you are in a trending environment, use moving averages to determine trend strength. If price is moving sideways, use oscillators. Remember that the ADX line does not indicate the direction of a trend. A falling ADX line tells you that prices are likely moving sideways. A rising ADX line tells you only that prices are trending. The trend can be either down or up. To determine the direction of the trend look to price action and other indicators such as moving averages. |
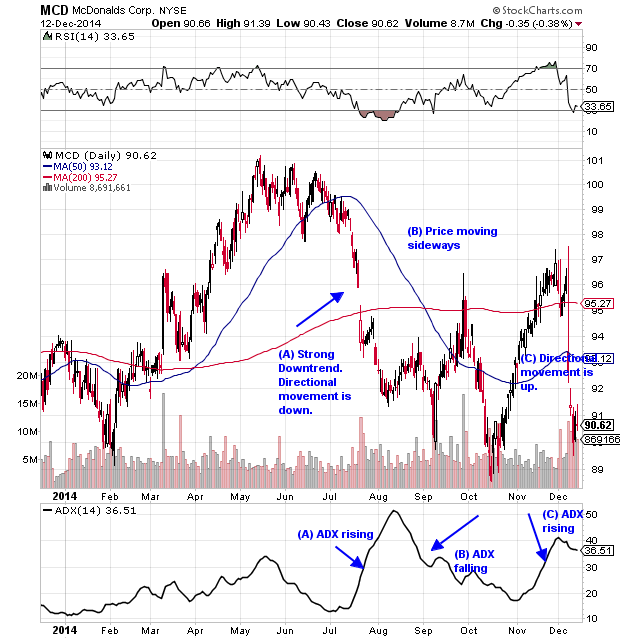
| For example, in Figure 1, you see that when McDonalds Corp (MCD) peaks and then reverses to the downside in July 2014, the ADX line rises sharply. This is evidence that the downtrend is strong. The ADX continues to rise and peaks at 50, then it turns and reverses to the downside. Price meanders sideways, forming a series of lower lows as the ADX line falls. Price makes a low in October and the ADX line reverses and begins to rise as price begins to form a short-term uptrend. |
|
| Figure 1. Trending Or Non-Trending? The average directional movement index (ADX) on the chart of McDonalds Corp. (MCD) rises sharply in July 2014. This suggests that the downtrend is strong. The ADX continues to rise adn peaks at 50, after which it reverses to the downside. Price moves sideways until October 2014. The ADX begins to rise and form as price begins to form a short-term uptrend. |
| Graphic provided by: StockCharts.com. |
| |
| The volatility of each security is different, so study the levels showing strong directional movement and vice versa for the particular security you are interested in, comparing the levels to past price history to get a sense of what constitutes high and low readings. Generally, Murray Ruggiero, in Cybernetic Trading Strategies uses the following rules: "If ADX crosses above 25, the market is trending. If ADX crosses below 20, the market is consolidating. If ADX crosses below 45 after being higher, the market is consolidating. If ADX rises above 10 on three of four days after being lower, the market will start to trend." from Perry Kaufman, New Trading Systems and Methods, Volume 4, page 1016. |
Stella Osoba is a trader and financial writer. She is a frequent contributor to "Technical Analysis of Stocks and Commodities" magazine and "Traders.com Advantage" as well as other financial publications.
| E-mail address: | stellaosoba@gmail.com |
Click here for more information about our publications!
Comments

Request Information From Our Sponsors
- StockCharts.com, Inc.
- Candle Patterns
- Candlestick Charting Explained
- Intermarket Technical Analysis
- John Murphy on Chart Analysis
- John Murphy's Chart Pattern Recognition
- John Murphy's Market Message
- MurphyExplainsMarketAnalysis-Intermarket Analysis
- MurphyExplainsMarketAnalysis-Visual Analysis
- StockCharts.com
- Technical Analysis of the Financial Markets
- The Visual Investor
- VectorVest, Inc.
- Executive Premier Workshop
- One-Day Options Course
- OptionsPro
- Retirement Income Workshop
- Sure-Fire Trading Systems (VectorVest, Inc.)
- Trading as a Business Workshop
- VectorVest 7 EOD
- VectorVest 7 RealTime/IntraDay
- VectorVest AutoTester
- VectorVest Educational Services
- VectorVest OnLine
- VectorVest Options Analyzer
- VectorVest ProGraphics v6.0
- VectorVest ProTrader 7
- VectorVest RealTime Derby Tool
- VectorVest Simulator
- VectorVest Variator
- VectorVest Watchdog