HOT TOPICS LIST
- MACD
- Fibonacci
- RSI
- Gann
- ADXR
- Stochastics
- Volume
- Triangles
- Futures
- Cycles
- Volatility
- ZIGZAG
- MESA
- Retracement
- Aroon
INDICATORS LIST
LIST OF TOPICS
PRINT THIS ARTICLE
by Donald W. Pendergast, Jr.
Shares of the S&P Select Financial SPDR fund are declining fast — right into a strong support area.
Position: N/A
Donald W. Pendergast, Jr.
Freelance financial markets writer and online publisher of the Trendzetterz.com S&P 500 Weekly Forecast service.
PRINT THIS ARTICLE
CYCLES
XLF: More Downside Into Cycle Low
12/17/14 04:40:36 PMby Donald W. Pendergast, Jr.
Shares of the S&P Select Financial SPDR fund are declining fast — right into a strong support area.
Position: N/A
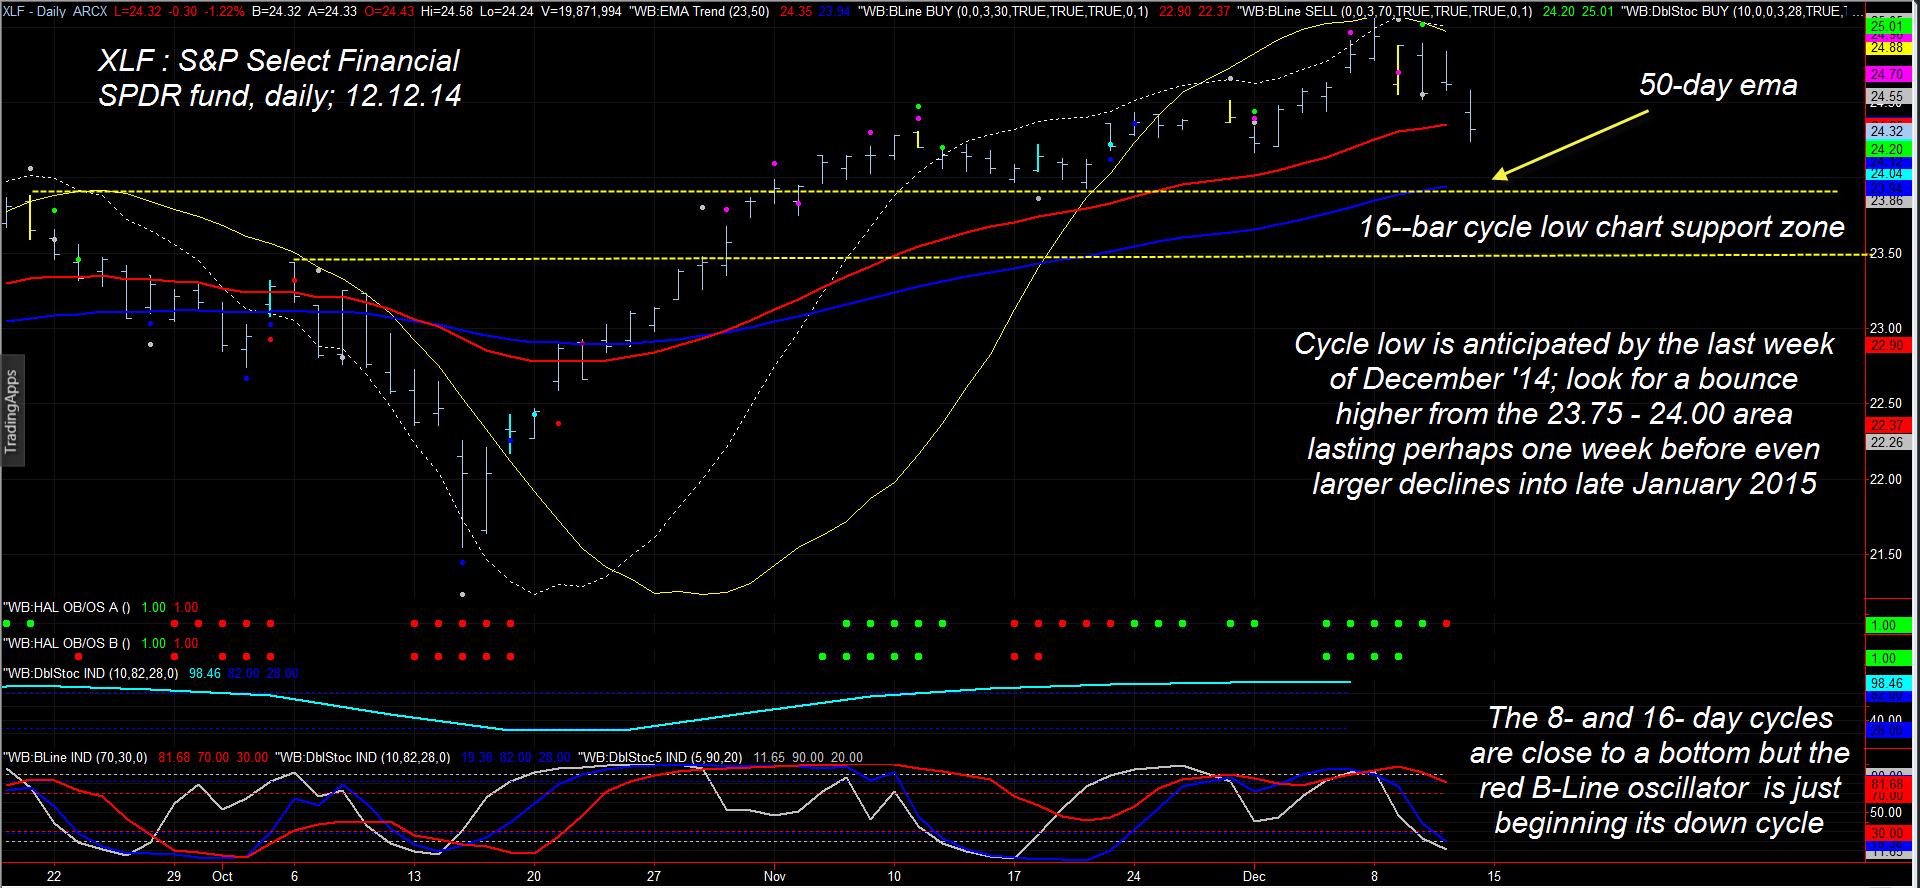
| The dramatic and rare 'V' bottom of October 2014 set the stage for a powerful, market-wide rally that took the S&P 500 index (.SPX) to record highs; whether or not the index is planning a last-ditch attempt at a Santa Claus rally into early 2015 remains to be seen, but it is clear that the financial sector stocks are still dropping and should soon find support based on price cycle and various chart dynamics. Here's a closer look now (Figure 1). |

|
| Figure 1. Mid-Cycle Pause? Cycles and support/resistance dynamics suggest that XLF should bottom in the upper $23 range sometime before year-end 2014; larger declines are anticipated into the first quarter of 2015, however. |
| Graphic provided by: TradeStation. |
| Graphic provided by: ProfitTrader7 from www.walterbressert.com. |
| |
| The S&P Select Financial SPDR (XLF) is comprised of the biggest banking and insurance sector names in the .SPX and accounts for the largest percentage of stocks within the nine sectors within the index. With such a relatively heavy weighting, it's little surprise that these are the key stocks to watch in the midst of broad market moves in either direction, often leading the .SPX higher or lower. XLF topped in a significant cycle high on December 8, 2014 and is now descending into what is sometimes called a "mid-cycle pause" — an area of a countertrend rally before the ultimate decline into a meaningful bottom. Here's how things are shaping up for XLF moving into year-end: 1. Both the primary 16- and 29-day cycles have topped and are now moving down in concert; the 16-day cycle is expected to bottom no later than the last week of 2014. 2. The 50-day exponential moving average (EMA; blue line) is near 23.95 and should help the 16-day cycle low to appear within the next seven to 10 trading sessions, if not before. This cycle low 'should' see a bullish bounce of three to five trading sessions before XLF rolls over, breaks below the 50-day EMA and moves down into the 29-day cycle low sometime in January 2015. 3. There is major chart support based on the November swing low (23.93) and the September swing high (23.88) and these also coincide with the 50-day EMA. 4. .SPX is also trading near its 50-day EMA and this is proving to be meaningful support during Friday's session (December 12, 2014) as this is written. 5. Analysis of 30 minute charts for XLF and SPY also reveal that the .SPX may be prepping for a bullish bounce; there are three distinct bearish thrusts lower since December 7th and this set of waves look to be complete. |

|
| Figure 2. Sector Watch. XLF, XLV, and XLU are still trading above their daily dynamic trailing stop levels and are also the three strongest sectors within the .SPX (S&P 500 index). |
| Graphic provided by: TradeStation. |
| Graphic provided by: TradeStation RadarScreen and Fibozachi.com. |
| |
| The big idea here is that XLF may have a bit more downside until swing traders can get on board a tradable bullish bounce; if you see clear signs of reversal near 23.80 to 24.00 and also witness the .SPX turning higher, the odds favor perhaps a week of rally before the next critical turning point manifests. Focus on the strongest relative strength banking, broker, and insurance company issues as the next bounce commences and be very nimble with your trade management and profit targets before the move fizzles and even lower lows in XLF appear as it drops into a bigger cycle low in early 2015. |
Freelance financial markets writer and online publisher of the Trendzetterz.com S&P 500 Weekly Forecast service.
| Title: | Market consultant and writer |
| Company: | Trendzetterz |
| Address: | 81 Hickory Hollow Drive |
| Crossville, TN 38555 | |
| Phone # for sales: | 904-303-4814 |
| Website: | trendzetterz.com |
| E-mail address: | support@trendzetterz.com |
Traders' Resource Links | |
| Trendzetterz has not added any product or service information to TRADERS' RESOURCE. | |
Click here for more information about our publications!
PRINT THIS ARTICLE

Request Information From Our Sponsors
- StockCharts.com, Inc.
- Candle Patterns
- Candlestick Charting Explained
- Intermarket Technical Analysis
- John Murphy on Chart Analysis
- John Murphy's Chart Pattern Recognition
- John Murphy's Market Message
- MurphyExplainsMarketAnalysis-Intermarket Analysis
- MurphyExplainsMarketAnalysis-Visual Analysis
- StockCharts.com
- Technical Analysis of the Financial Markets
- The Visual Investor
- VectorVest, Inc.
- Executive Premier Workshop
- One-Day Options Course
- OptionsPro
- Retirement Income Workshop
- Sure-Fire Trading Systems (VectorVest, Inc.)
- Trading as a Business Workshop
- VectorVest 7 EOD
- VectorVest 7 RealTime/IntraDay
- VectorVest AutoTester
- VectorVest Educational Services
- VectorVest OnLine
- VectorVest Options Analyzer
- VectorVest ProGraphics v6.0
- VectorVest ProTrader 7
- VectorVest RealTime Derby Tool
- VectorVest Simulator
- VectorVest Variator
- VectorVest Watchdog
