HOT TOPICS LIST
- MACD
- Fibonacci
- RSI
- Gann
- ADXR
- Stochastics
- Volume
- Triangles
- Futures
- Cycles
- Volatility
- ZIGZAG
- MESA
- Retracement
- Aroon
INDICATORS LIST
LIST OF TOPICS
PRINT THIS ARTICLE
by Donald W. Pendergast, Jr.
Shares of Yamana Gold, Inc. may have finally turned the corner, transitioning from a bearish to bullish long-term price cycle.
Position: N/A
Donald W. Pendergast, Jr.
Freelance financial markets writer and online publisher of the Trendzetterz.com S&P 500 Weekly Forecast service.
PRINT THIS ARTICLE
REVERSAL
AUY: Bullish Trend Reversal
12/15/14 05:37:55 PMby Donald W. Pendergast, Jr.
Shares of Yamana Gold, Inc. may have finally turned the corner, transitioning from a bearish to bullish long-term price cycle.
Position: N/A
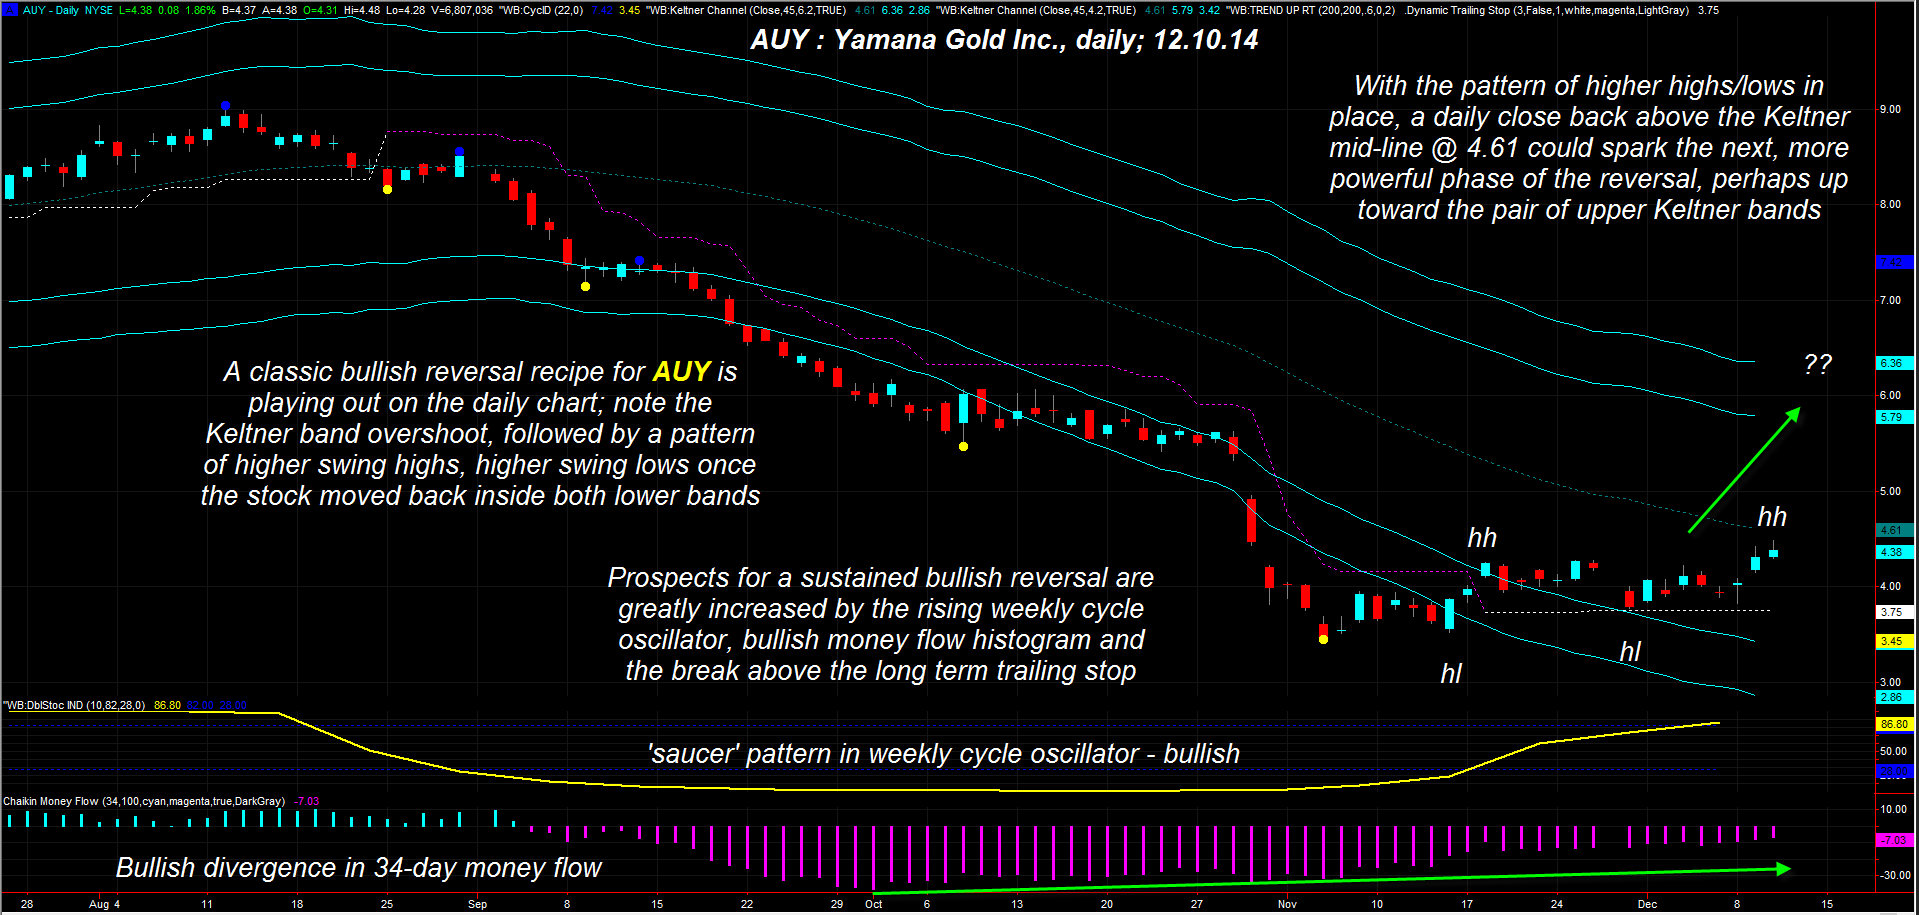
| Yamana Gold, Inc. common shares (AUY) suffered a 61.8% decline between August 12 and November 5, 2014, tumbling all the way to $3.45 per share; many other component stocks in the CBOE gold index also saw declines of 40-65% in the same span of time, allowing trend followers to book some large gains on the ride south. But after the entire industry group bottomed together in early November 2014, the seeds were being sown for the slow yet steady bullish trend reversal underway for the past five weeks. Here's a closer look at on of the better-defined reversal patterns in the group — found on the daily chart for AUY (see Figure 1). |

|
| Figure 1. Daily Chart Of Yamana Gold, Inc. (AUY). The stock of AUY appears to be in the early stages of a bullish reversal; the next price target is the bottom of the open gap near $4.95. |
| Graphic provided by: TradeStation. |
| Graphic provided by: www.walterbressert.com and Fibozachi.com. |
| |
| It's during the scariest part of any major sell-off that savvy traders and investors begin to monitor a stock or exchange traded fund (ETF) for the tell-tale signs that the move is nearing exhaustion; such signs include: 1. Super high 10-day ADX readings (65 or greater) 2. A sharp plunge beneath the bottom-most Keltner band, usually on heavy volume 3. An extended fifth wave of a well-defined Elliott impulse structure 4. Bullish price/money flow divergences 5. The anticipated bottoming of a higher time frame price cycle 6. Super wide-range daily price bars that have extreme volume Sometimes you will see all of these dynamics come into place in a short period of time. Other times they may occur more randomly, but if you see three or more of these at work at the same time, you may have a good reversal candidate to put on your watch list. Many of the dynamics were at work on AUY's daily chart; the October 30, 2014 plunge beneath the lower band was accompanied by ultra-high volume, as was the next trading session's action. At the same time, the money flow histogram was already confirming a bullish divergence (the "smart money" slowly building a long position as the decline matured) and the weekly cycle oscillator had already bottomed out. The first significant confirmation that price had indeed bottomed was when AUY managed to close back inside both the lower bands (November 14 and November 18, 2014 respectively). The November 18, 2014 high also confirmed a pattern of higher swing highs and higher swing lows. Note also that the trailing stop reversed from a short to a long bias on November 18, 2014 and that AUY is still in a valid long trend following trade as this is written; the current stop loss is at $3.75. |

|
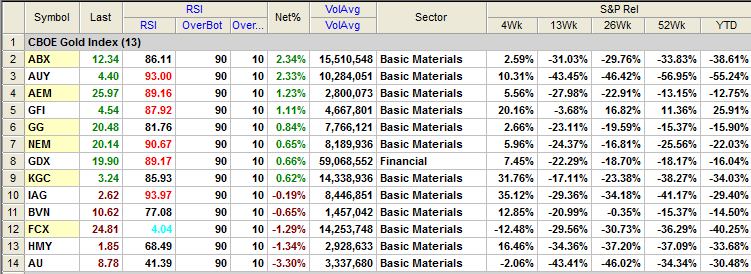
| Figure 2. Sector Performance. ABX, AUY, and AEM have the best overall bullish reversal patterns and price action as of December 10, 2014. |
| Graphic provided by: TradeStation. |
| Graphic provided by: TradeStation 9.1 RadarScreen. |
| |
| Traders desiring to get long AUY now might want to wait for the next 60-minute pullback to the 21-bar exponential moving average (EMA) support line near 4.20-4.25 before entering, looking for AUY to run higher toward the 4.90-4.95 area; the use of a volatility-based trailing stop can be an effective way to capture profits and minimize risk on a setup like this one. Account risk should be limited to 2% or less, regardless of your bullish bias on gold or gold stocks; for what it's worth, gold (GLD) has also made a convincing five-wave Elliott completion pattern on its weekly chart, implying a healthy corrective wave bounce into 2015. Trade wisely until we meet here again. |
Freelance financial markets writer and online publisher of the Trendzetterz.com S&P 500 Weekly Forecast service.
| Title: | Market consultant and writer |
| Company: | Trendzetterz |
| Address: | 81 Hickory Hollow Drive |
| Crossville, TN 38555 | |
| Phone # for sales: | 904-303-4814 |
| Website: | trendzetterz.com |
| E-mail address: | support@trendzetterz.com |
Traders' Resource Links | |
| Trendzetterz has not added any product or service information to TRADERS' RESOURCE. | |
Click here for more information about our publications!
PRINT THIS ARTICLE

Request Information From Our Sponsors
- VectorVest, Inc.
- Executive Premier Workshop
- One-Day Options Course
- OptionsPro
- Retirement Income Workshop
- Sure-Fire Trading Systems (VectorVest, Inc.)
- Trading as a Business Workshop
- VectorVest 7 EOD
- VectorVest 7 RealTime/IntraDay
- VectorVest AutoTester
- VectorVest Educational Services
- VectorVest OnLine
- VectorVest Options Analyzer
- VectorVest ProGraphics v6.0
- VectorVest ProTrader 7
- VectorVest RealTime Derby Tool
- VectorVest Simulator
- VectorVest Variator
- VectorVest Watchdog
- StockCharts.com, Inc.
- Candle Patterns
- Candlestick Charting Explained
- Intermarket Technical Analysis
- John Murphy on Chart Analysis
- John Murphy's Chart Pattern Recognition
- John Murphy's Market Message
- MurphyExplainsMarketAnalysis-Intermarket Analysis
- MurphyExplainsMarketAnalysis-Visual Analysis
- StockCharts.com
- Technical Analysis of the Financial Markets
- The Visual Investor
