

HOT TOPICS LIST
- MACD
- Fibonacci
- RSI
- Gann
- ADXR
- Stochastics
- Volume
- Triangles
- Futures
- Cycles
- Volatility
- ZIGZAG
- MESA
- Retracement
- Aroon
INDICATORS LIST
LIST OF TOPICS
PRINT THIS ARTICLE
by Alan R. Northam
Statistical analysis shows the intermediate-term trend of Exxon Mobil close to reversing from an upward trend to a downward trend.
Position: N/A
Alan R. Northam
Alan Northam lives in the Dallas, Texas area and as an electronic engineer gave him an analytical mind from which he has developed a thorough knowledge of stock market technical analysis. His abilities to analyze the future direction of the stock market has allowed him to successfully trade of his own portfolio over the last 30 years. Mr. Northam is now retired and trading the stock market full time. You can reach him at inquiry@tradersclassroom.com or by visiting his website at http://www.tradersclassroom.com. You can also follow him on Twitter @TradersClassrm.
PRINT THIS ARTICLE
Exxon Mobil Intermediate-Term Trend, Troubling!
12/12/14 04:03:34 PMby Alan R. Northam
Statistical analysis shows the intermediate-term trend of Exxon Mobil close to reversing from an upward trend to a downward trend.
Position: N/A
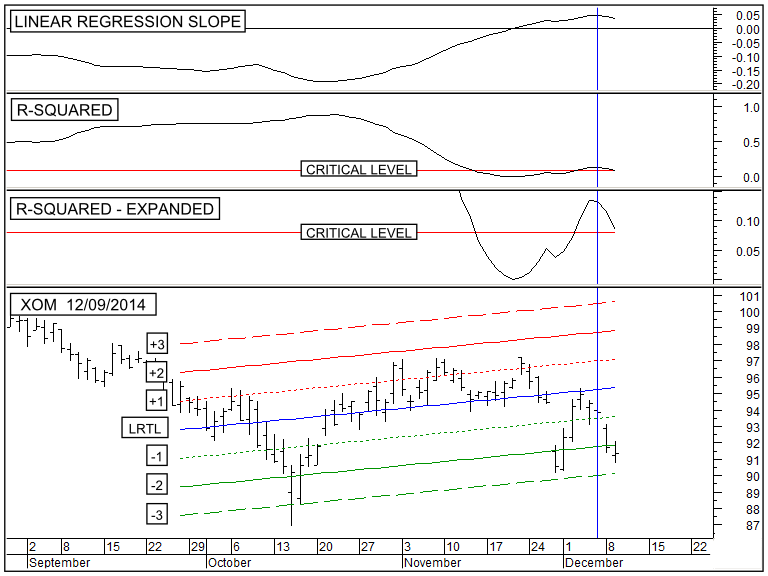
| Once it has been determined that the long-term trend of Exxon Mobil has reversed from an upward trend to a downward trend (See "Exxon Begins Long-Term Downward Trend" published December 5, 2014) it is time to look at the intermediate-term trend. Figure 1 shows the 50-day linear regression slope indicator in the upper panel, the R-squared indicator in the middle two panels and the daily price bars of Exxon Mobil (XOM) in the bottom panel. The bottom panel also shows the 50-day linear regression trend line (blue upward sloping line) along with the upper 1 sigma channel line (red dotted line), the upper 2 sigma channel line (solid red line), the upper 3 sigma channel line (dashed red line), the lower 1 sigma channel line (green dotted line), the lower 2 sigma channel line (solid green line), and the lower 3 sigma channel line (dashed green line). The red channel lines represent resistance lines and the green channel lines represent support. |
|
| Figure 1: Daily Chart Of Exxon Mobil (XOM). Here you see the daily price chart of XOM in the lower panel along with its 50-day linear regression trend line and its associate channel lines. The top panel shows the linear regression slope indicator. The middle two panels show the R-squared indicator in two differing vertical scales for clarity. |
| Graphic provided by: MetaStock. |
| Graphic provided by: Serif DrawPlus X3 Graphics Studio. |
| |
| The linear regression slope indicator in the top panel of Figure 1 shows the slope of the linear regression trend line. The higher it moves above the zero line the steeper the upward slope of the linear regression trend line. Once the linear regression trend line peaks, as it did on December 5, 2014 and starts to move in a downward direction, the slope of the linear regression trend line starts to become shallower. I call this the deceleration period. Deceleration normally occurs near the end of a trend. Notice that the linear regression slope indicator has not yet moved below its zero line indicating that the slope of the linear regression trend line continues to indicate an intermediate-term upward trend. However, it also shows an upward trend that continues to become shallower with each passing day. A crossing of the zero line would indicate a reversal in trend. |
| The R-squared indicator in the middle panel of Figure 1 shows when price is in a statistically significant trend. By statistically significant, it is meant there is statistically a 95% confidence level that the trend will continue. When the R-squared indicator moves above its critical level, price enters a statistically significant trend. Note the critical level changes with the length of the trend. For intermediate-term trends the critical level is near zero at 0.08. However, as the length of the trend shortens, the critical level moves higher. Notice the critical level reading of 0.085 indicates a statistically significant upward trend. This reading is difficult to make because of the scaling of the graph. However, when the graph scale is changed it becomes easier to see that the R-squared indicator has moved above its critical level. For this reason I have added a second R-squared indicator graph to Figure 1. Notice this indicator is moving in a downward direction and is close to moving below its critical level. A crossing below the critical level will indicate a lack of a statistically significant intermediate-term upward trend. This would then mean there is no longer a statistical 95% confidence level that the intermediate-term upward trend will continue. |
| The chart in the bottom panel of Figure 1 shows price moving between the -3 sigma channel line and the +2 sigma channel line from October 2014 through December 2014. Price movement between the +2 sigma channel line and the -2 sigma channel line represents a period of high volatility that normally occurs at or near trend reversal points. Note also that price has moved below the -2 sigma channel line warning of a possible reversal in trend from up to down. A cross to below the -3 sigma channel line will signal that a trend reversal is in progress. A trend reversal would then be confirmed by the linear regression slope indicator moving below its zero line and the R-squared indicator moving below its critical level and then back above its critical level. |
| In conclusion, statistical analysis shows XOM in an intermediate-term upward trend. However, statistical analysis also shows that price has moved below its -2 sigma channel line to warn of a possible reversal in trend from an intermediate-term upward trend to an intermediate-term downward trend ahead. |
Alan Northam lives in the Dallas, Texas area and as an electronic engineer gave him an analytical mind from which he has developed a thorough knowledge of stock market technical analysis. His abilities to analyze the future direction of the stock market has allowed him to successfully trade of his own portfolio over the last 30 years. Mr. Northam is now retired and trading the stock market full time. You can reach him at inquiry@tradersclassroom.com or by visiting his website at http://www.tradersclassroom.com. You can also follow him on Twitter @TradersClassrm.
| Garland, Tx | |
| Website: | www.tradersclassroom.com |
| E-mail address: | inquiry@tradersclassroom.com |
Click here for more information about our publications!
Comments

Request Information From Our Sponsors
- VectorVest, Inc.
- Executive Premier Workshop
- One-Day Options Course
- OptionsPro
- Retirement Income Workshop
- Sure-Fire Trading Systems (VectorVest, Inc.)
- Trading as a Business Workshop
- VectorVest 7 EOD
- VectorVest 7 RealTime/IntraDay
- VectorVest AutoTester
- VectorVest Educational Services
- VectorVest OnLine
- VectorVest Options Analyzer
- VectorVest ProGraphics v6.0
- VectorVest ProTrader 7
- VectorVest RealTime Derby Tool
- VectorVest Simulator
- VectorVest Variator
- VectorVest Watchdog
- StockCharts.com, Inc.
- Candle Patterns
- Candlestick Charting Explained
- Intermarket Technical Analysis
- John Murphy on Chart Analysis
- John Murphy's Chart Pattern Recognition
- John Murphy's Market Message
- MurphyExplainsMarketAnalysis-Intermarket Analysis
- MurphyExplainsMarketAnalysis-Visual Analysis
- StockCharts.com
- Technical Analysis of the Financial Markets
- The Visual Investor