

HOT TOPICS LIST
- MACD
- Fibonacci
- RSI
- Gann
- ADXR
- Stochastics
- Volume
- Triangles
- Futures
- Cycles
- Volatility
- ZIGZAG
- MESA
- Retracement
- Aroon
INDICATORS LIST
LIST OF TOPICS
PRINT THIS ARTICLE
by Stella Osoba, CMT
Information bias is a cognitive bias which leads us to believe that more information is better or complexity is preferable to simplicity. Sometimes we collect information which is ultimately irrelevant to the decision we are trying to make but we feel more confident in making the decision because of the extra, irrelevant information.
Position: N/A
Stella Osoba, CMT
Stella Osoba is a trader and financial writer. She is a frequent contributor to "Technical Analysis of Stocks and Commodities" magazine and "Traders.com Advantage" as well as other financial publications.
PRINT THIS ARTICLE
PSYCHOLOGY
Information Bias, Or Why More Is Not Necessarily Better
12/10/14 03:25:57 PMby Stella Osoba, CMT
Information bias is a cognitive bias which leads us to believe that more information is better or complexity is preferable to simplicity. Sometimes we collect information which is ultimately irrelevant to the decision we are trying to make but we feel more confident in making the decision because of the extra, irrelevant information.
Position: N/A
| In mathematics, "necessary and sufficient" is a term used to describe the optimal amount of information that is necessary to have in order to do something. It is a term which can be applied to anything, from making a pencil to building a rocket ship. Before embarking on any endeavor, it is important to gather the information that is necessary and sufficient to complete the task. This is the optimal amount of information needed. Once you have gathered information which is necessary and sufficient, more information will not help you accomplish the task better and might even hinder the successful completion of the task by confusing matters. The question we then have to ask ourselves, is, how much information is necessary and sufficient to have to succeed in the stock market? Once we have answered this question, we don't need to gather more information to make a decision on a trade. |
| Too often people answer this question with a cognitive bias called information bias which is the belief that more information is better information. People will often feel a false sense of prowess when armed with more information even when that information is largely irrelevant to the decision at hand. It is for this reason that sometimes traders will use many more indicators and studies on charts than is necessary. They will look to complex models, algorithms, and proprietary trading packages. But more information does not equal better and neither does complexity increase one's chances of success in the markets. It is worth remembering the principle known as Occam's Razor which in it's simplest form alludes to the idea that simplicity usually is the best way to arrive at the truth of something. |
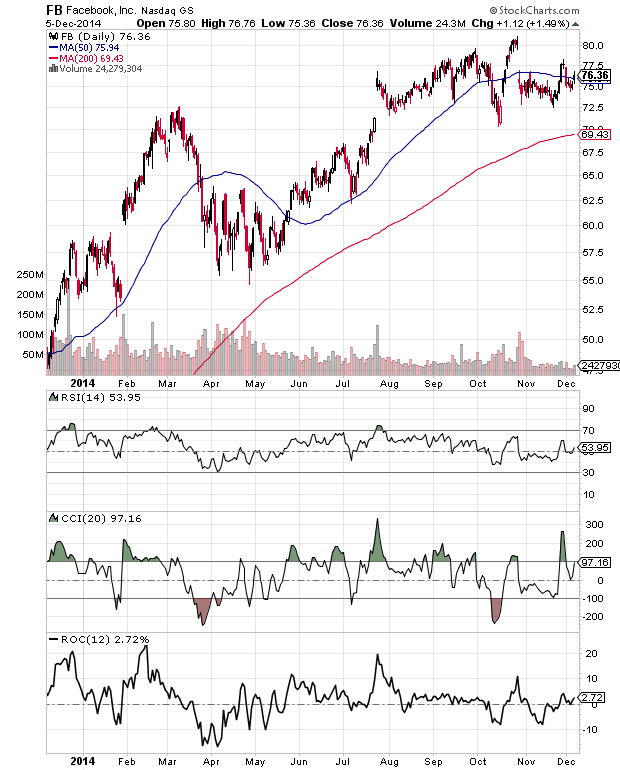
| In technical analysis, the primary data all tools derive from is price and volume. All the indicators and algorithms that are used are developed from manipulating these primary sources of data. Therefore, there is no reason to have multiple indicators on a chart when many of those indicators provide repetitive information. The problem with using repetitive statistical indicators is described as multi-collinearity. The indicators used on the chart in Figure 1 are all momentum indicators and are all saying basically the same thing. It is not necessary to use all three indicators. |
|
| Figure 1. Momentum Indicators. The relative strength index (RSI), rate of change (ROC) and commodity channel index (CCI) are all momentum indicators and say basically the same thing, therefore it is not necessary to use all three. |
| Graphic provided by: StockCharts.com. |
| |
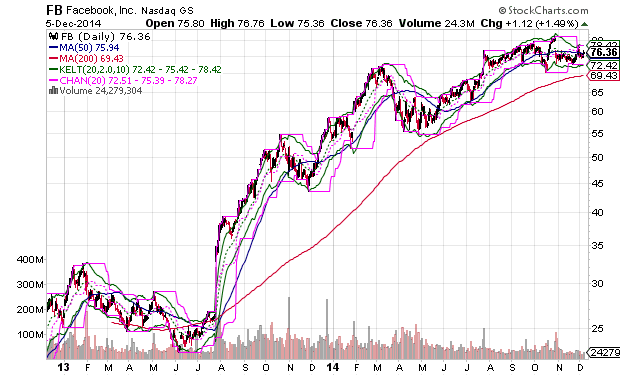
| Any software charting program will include dozens of indicators. Therefore, it is necessary to be selective. Use indicators and studies that give you different information, not ones that duplicate the information you are getting from an indicator you are already using. For instance, there is little point in using both rate of change (ROC), which is a momentum indicator and relative strength index (RSI) which is another momentum indicator unless you know they can show you different things about the behavior of price. The important thing about using indicators is to select them carefully and know them thoroughly. Indicators fall roughly into three categories; momentum, trend, and volume. Be aware of this when building your chart studies and ask the question, what information is necessary and sufficient for me to have to analyze the market efficiently? Resist the urge to clutter your charts as you see in Figure 2, because more is not necessarily better. |
|
| Figure 2. Cluttered Chart. There is too much information on this chart. There are moving averages, Bollinger Bands, price channels, and Keltner channels. All of these provide similar information and add little to price analysis. |
| Graphic provided by: StockCharts.com. |
| |
Stella Osoba is a trader and financial writer. She is a frequent contributor to "Technical Analysis of Stocks and Commodities" magazine and "Traders.com Advantage" as well as other financial publications.
| E-mail address: | stellaosoba@gmail.com |
Click here for more information about our publications!
PRINT THIS ARTICLE

Request Information From Our Sponsors
- StockCharts.com, Inc.
- Candle Patterns
- Candlestick Charting Explained
- Intermarket Technical Analysis
- John Murphy on Chart Analysis
- John Murphy's Chart Pattern Recognition
- John Murphy's Market Message
- MurphyExplainsMarketAnalysis-Intermarket Analysis
- MurphyExplainsMarketAnalysis-Visual Analysis
- StockCharts.com
- Technical Analysis of the Financial Markets
- The Visual Investor
- VectorVest, Inc.
- Executive Premier Workshop
- One-Day Options Course
- OptionsPro
- Retirement Income Workshop
- Sure-Fire Trading Systems (VectorVest, Inc.)
- Trading as a Business Workshop
- VectorVest 7 EOD
- VectorVest 7 RealTime/IntraDay
- VectorVest AutoTester
- VectorVest Educational Services
- VectorVest OnLine
- VectorVest Options Analyzer
- VectorVest ProGraphics v6.0
- VectorVest ProTrader 7
- VectorVest RealTime Derby Tool
- VectorVest Simulator
- VectorVest Variator
- VectorVest Watchdog