HOT TOPICS LIST
- MACD
- Fibonacci
- RSI
- Gann
- ADXR
- Stochastics
- Volume
- Triangles
- Futures
- Cycles
- Volatility
- ZIGZAG
- MESA
- Retracement
- Aroon
INDICATORS LIST
LIST OF TOPICS
PRINT THIS ARTICLE
by Koos van der Merwe
To what extent should you accept an Elliott Wave count? When it suggests a sell signal, should you sell?
Position: Sell
Koos van der Merwe
Has been a technical analyst since 1969, and has worked as a futures and options trader with First Financial Futures in Johannesburg, South Africa.
PRINT THIS ARTICLE
ELLIOTT WAVE
When In Doubt Get Out, But....
12/10/14 03:16:33 PMby Koos van der Merwe
To what extent should you accept an Elliott Wave count? When it suggests a sell signal, should you sell?
Position: Sell
| When you examine charts, analysts use different techniques to determine where the market is going. Elliott Wave analysis is simply a signpost in the wilderness, and can change direction a little way down the road as the next signpost is found. We have a lot of signs pointing in one direction. We have an Elliott Wave count suggesting that a correction is now due, other indicators are confirming a correction, and many investors are starting to sell shares that are showing a loss as a tax savings on capital gains. Add to that world uncertainty starting to exert itself, the mantra "when in doubt, get out" is starting to be felt. The question of course is will this be a major correction or a minor correction and if it does occur, how long will it last? |

|
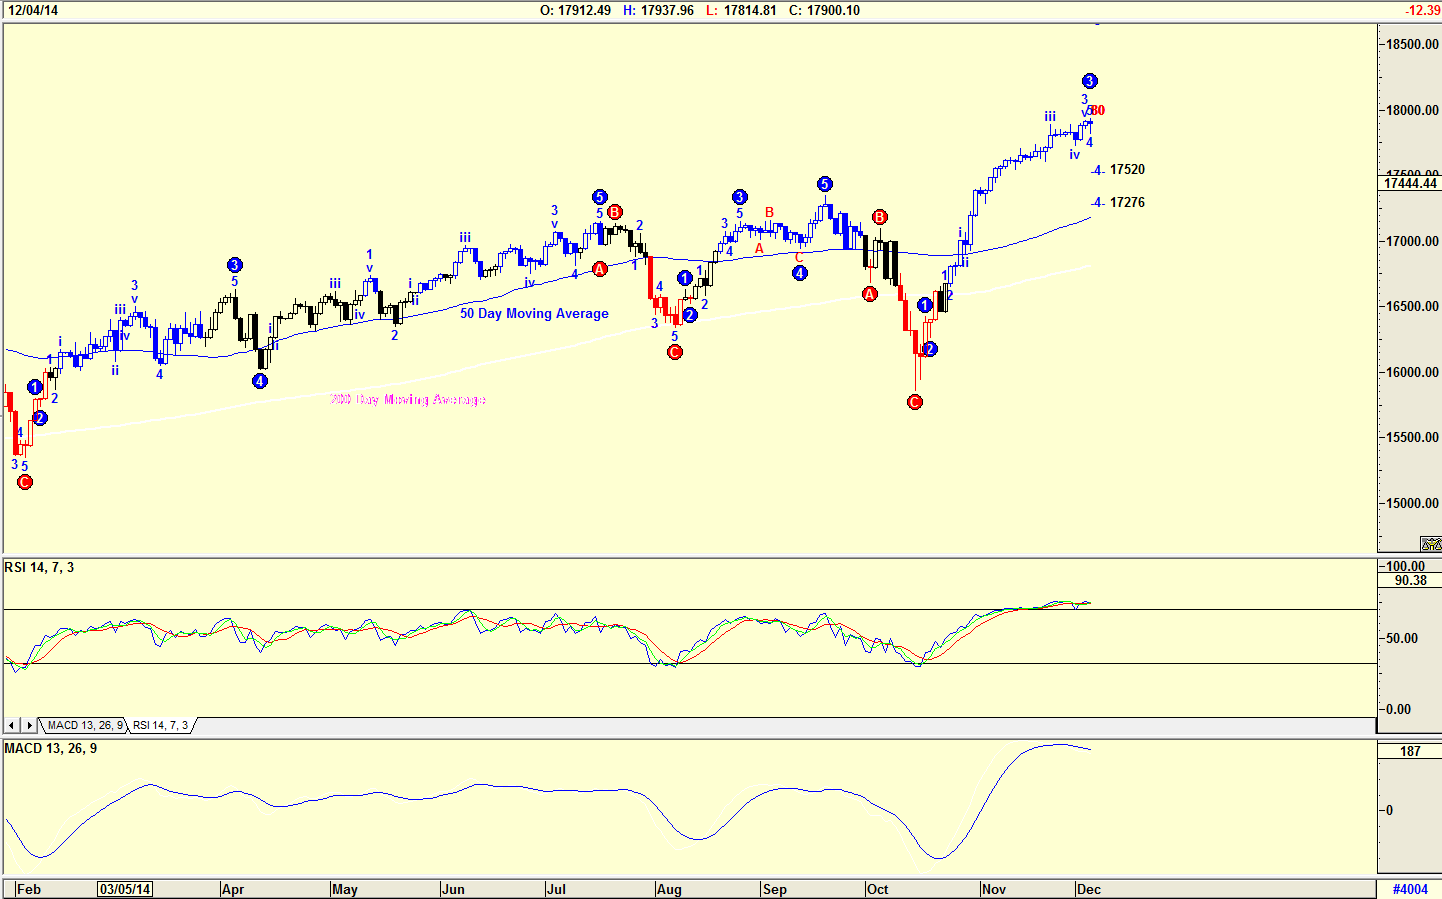
| Figure 1. Daily Chart Of The Dow Jones Industrial Average (DJIA). The Elliott Wave count suggests that the DJIA could be topping out in a WAVE 3. |
| Graphic provided by: AdvancedGET. |
| |
| The chart in Figure 1 is a daily chart of the Dow Jones Industrial Average (DJIA) with an Elliott Wave count suggesting that the DJIA could be topping out in a WAVE 3. The WAVE 4 target is either 17250 or 17276 as shown on the chart, but these targets can change depending on how the DJIA moves. Note that the relative strength index (RSI) is at overbought levels and the MACD indicator has given a sell signal. |

|
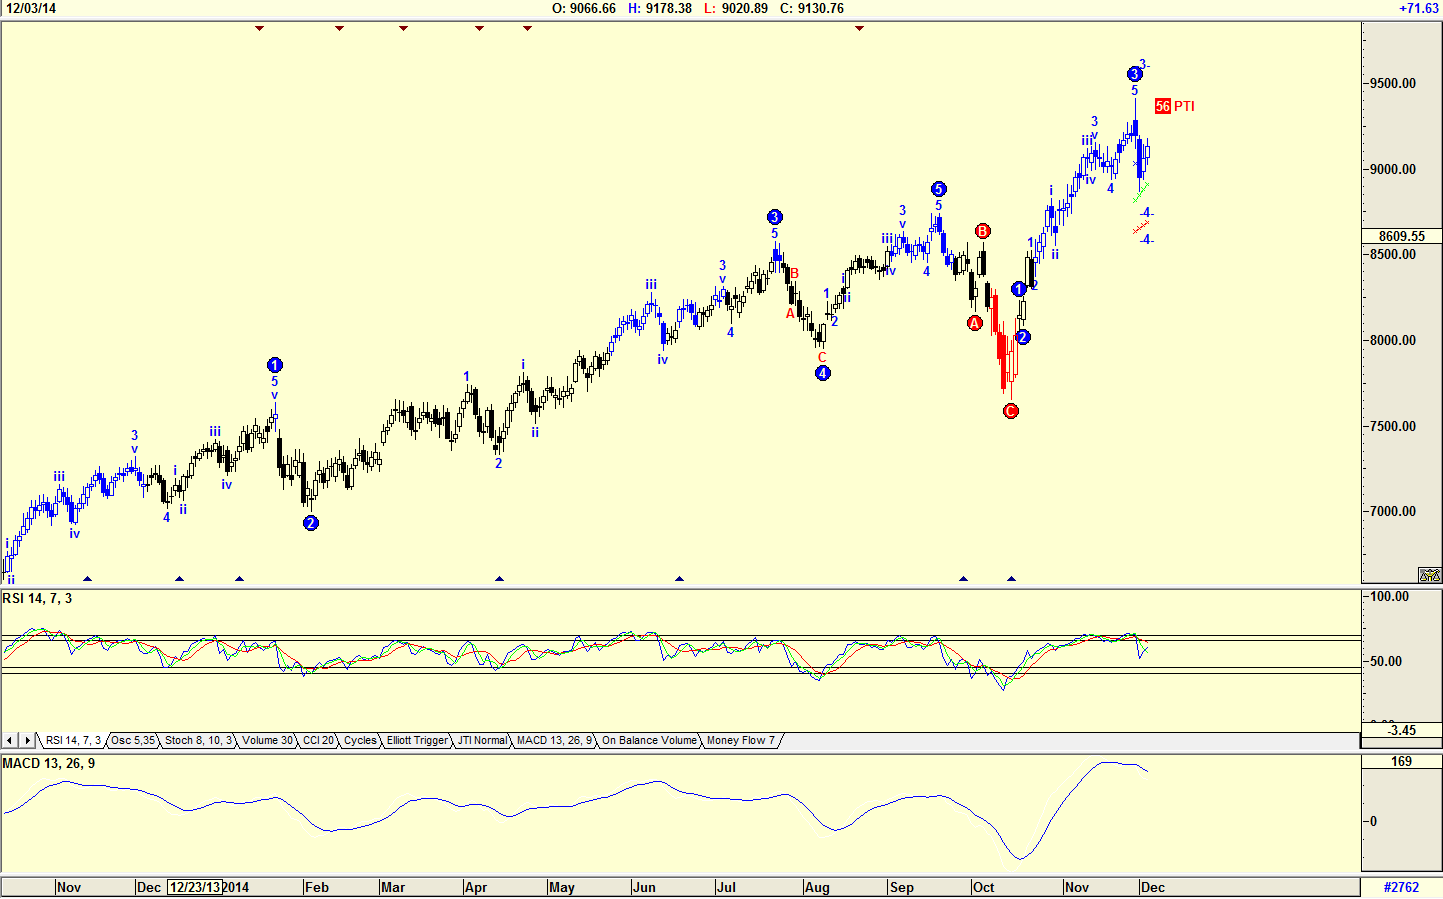
| Figure 2. Daily Chart Of The Dow Jones Transportation index. The Elliott Wave count has also topped out in a WAVE 3 suggesting a WAVE 4 correction. |
| Graphic provided by: AdvancedGET. |
| |
| The chart in Figure 2 is a daily chart of the Dow Jones Transportation index, where the Elliott Wave count has also topped out in a WAVE 3 suggesting a WAVE 4 correction. In this chart, the RSI has given a sell signal as has the MACD indicator. Usually the DJIA follows the Dow Jones Transportation index and the Utilities index which are said to be leading indicators. |

|
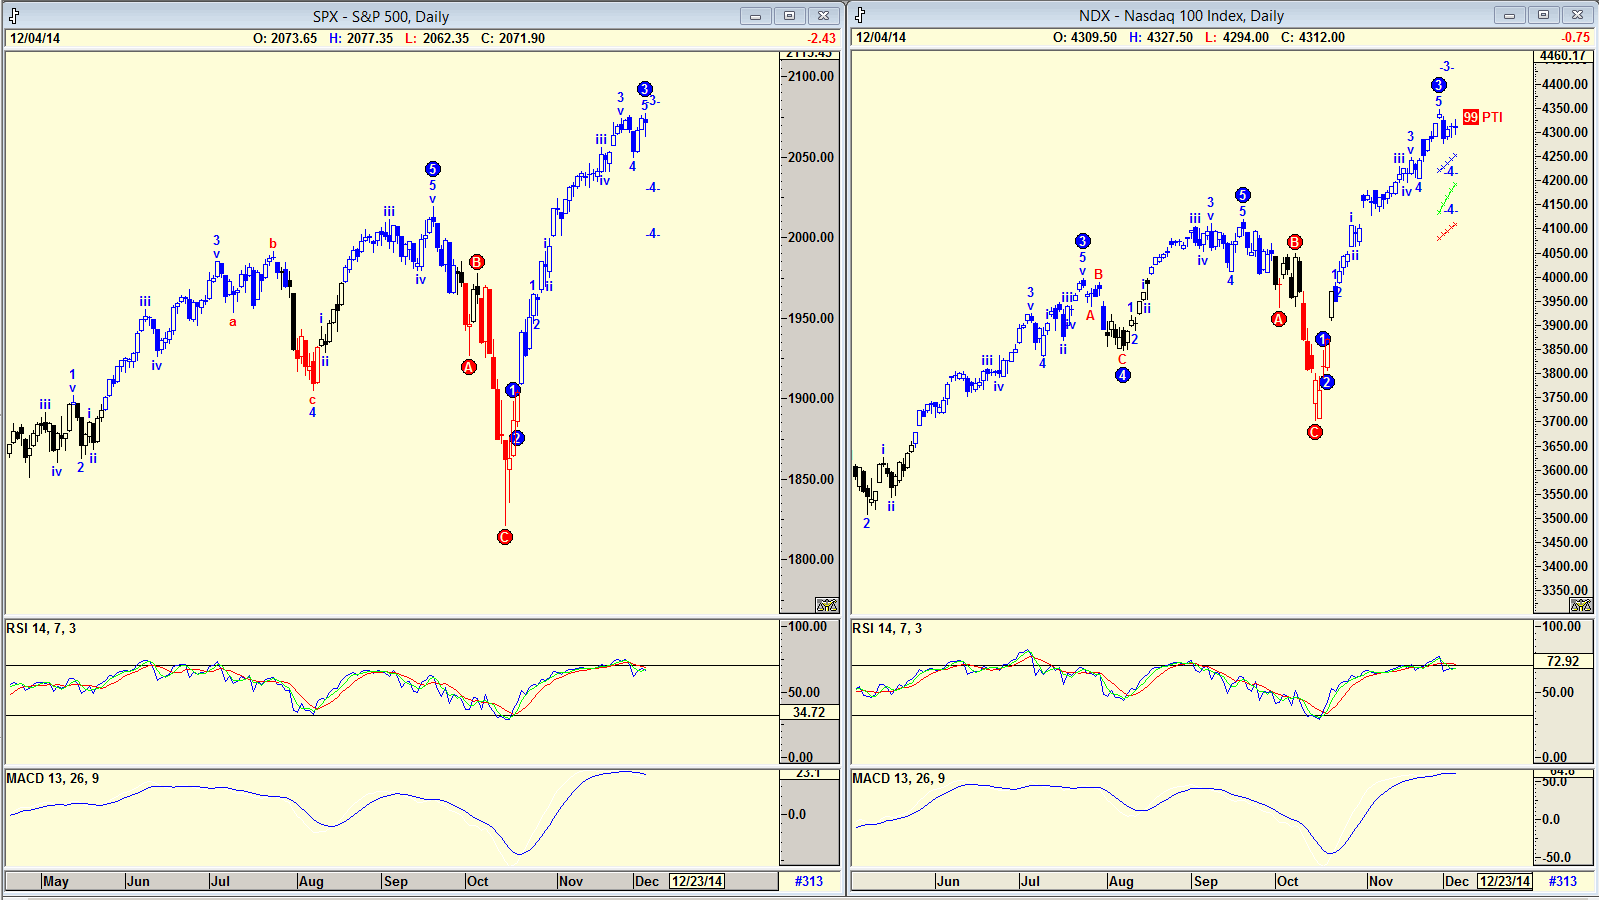
| Figure 3. Daily charts of the S&P 500 index and the Nasdaq 100 index. Both these show an Elliott Wave 3 formation suggesting a Wave 4 in the offing. |
| Graphic provided by: AdvancedGET. |
| |
| The chart in Figure 3 is a chart showing the S&P500 index and the Nasdaq 100 index, both of which show an Elliott Wave 3 formation suggesting a Wave 4 is in the offing. In both charts the RSI and the MACD are showing sell signals. |

|
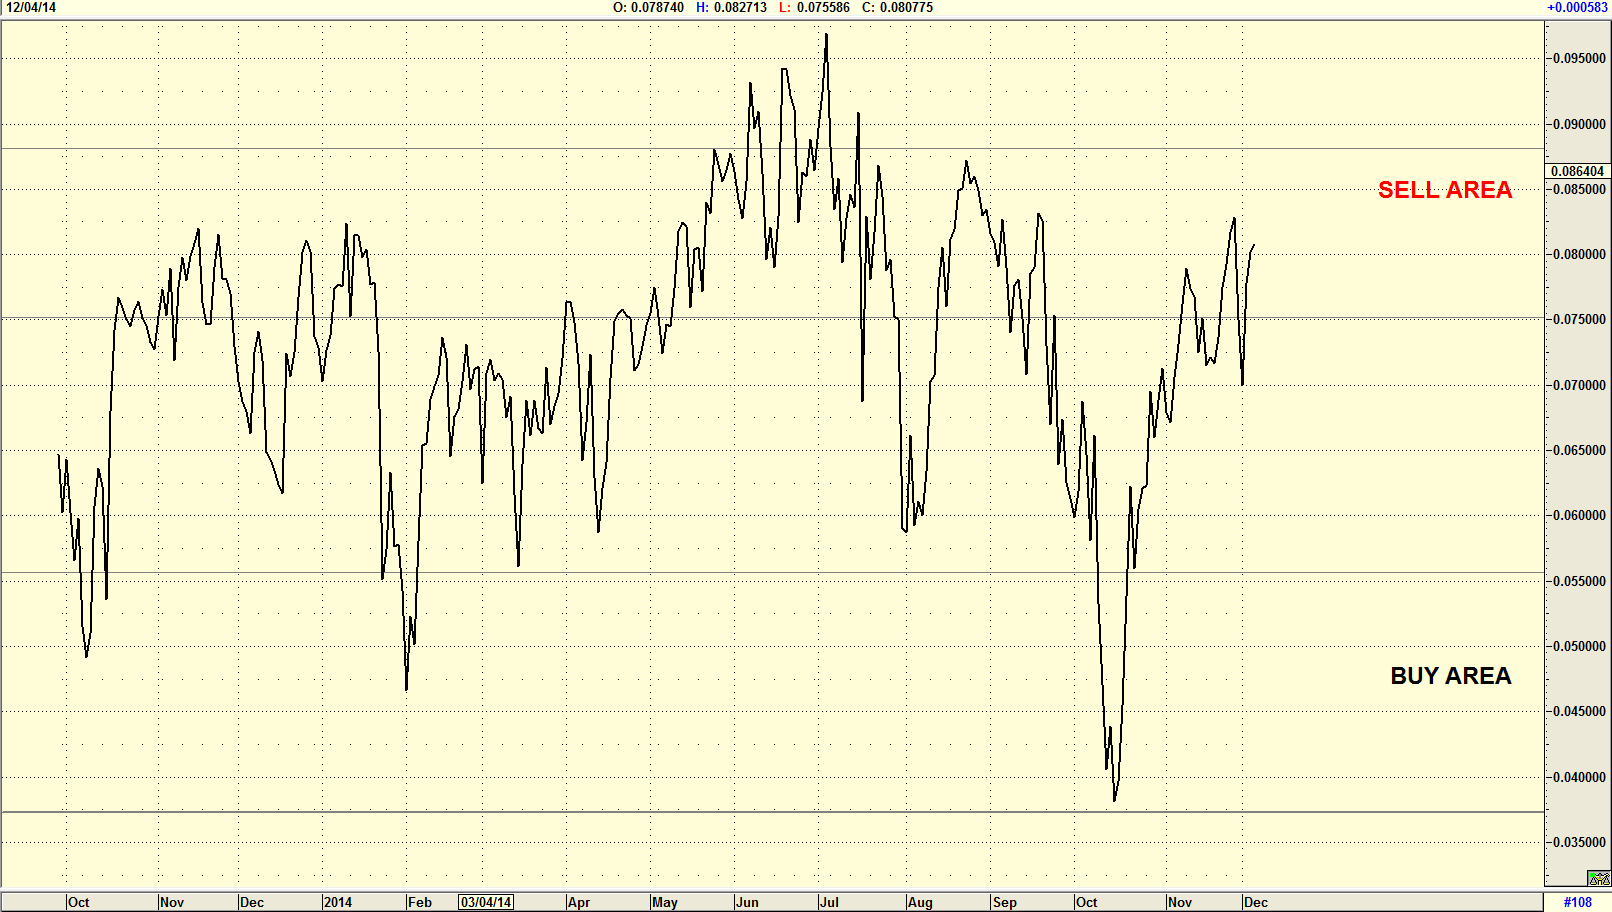
| Figure 4. Daily chart of the Volatility index (VIX) inverted. Here you see that the inverted VIX is in the sell area. |
| Graphic provided by: AdvancedGET. |
| |
| The chart in Figure 4 is a daily chart of the volatility index (VIX), inverted. The chart shows that the inverted VIX is presently in the sell area. With all the indexes suggesting that the market is due for a sell, the mantra, "when in doubt, get out," becomes a weight on one's mind. However, because the charts are suggesting the correction would be a WAVE 4, profits can be taken with the opportunity to buy the shares back as WAVE 4 bottoms. WAVE 5 will offer exceptional profits. |
Has been a technical analyst since 1969, and has worked as a futures and options trader with First Financial Futures in Johannesburg, South Africa.
| Address: | 3256 West 24th Ave |
| Vancouver, BC | |
| Phone # for sales: | 6042634214 |
| E-mail address: | petroosp@gmail.com |
Click here for more information about our publications!
PRINT THIS ARTICLE

|

Request Information From Our Sponsors
- VectorVest, Inc.
- Executive Premier Workshop
- One-Day Options Course
- OptionsPro
- Retirement Income Workshop
- Sure-Fire Trading Systems (VectorVest, Inc.)
- Trading as a Business Workshop
- VectorVest 7 EOD
- VectorVest 7 RealTime/IntraDay
- VectorVest AutoTester
- VectorVest Educational Services
- VectorVest OnLine
- VectorVest Options Analyzer
- VectorVest ProGraphics v6.0
- VectorVest ProTrader 7
- VectorVest RealTime Derby Tool
- VectorVest Simulator
- VectorVest Variator
- VectorVest Watchdog
- StockCharts.com, Inc.
- Candle Patterns
- Candlestick Charting Explained
- Intermarket Technical Analysis
- John Murphy on Chart Analysis
- John Murphy's Chart Pattern Recognition
- John Murphy's Market Message
- MurphyExplainsMarketAnalysis-Intermarket Analysis
- MurphyExplainsMarketAnalysis-Visual Analysis
- StockCharts.com
- Technical Analysis of the Financial Markets
- The Visual Investor
