

HOT TOPICS LIST
- MACD
- Fibonacci
- RSI
- Gann
- ADXR
- Stochastics
- Volume
- Triangles
- Futures
- Cycles
- Volatility
- ZIGZAG
- MESA
- Retracement
- Aroon
INDICATORS LIST
LIST OF TOPICS
PRINT THIS ARTICLE
by Stella Osoba, CMT
Overconfidence is a cognitive bias which results in our overestimating our abilities to perform a skill or task. In so doing, we see ourselves as better than average and we rate our abilities higher than others would rate us. In financial markets, this bias most often manifests itself in traders as aggressive trading or as an increase in trading volume. It is important, therefore, that we recognize this bias and find ways to effectively minimize its effects on our trading.
Position: N/A
Stella Osoba, CMT
Stella Osoba is a trader and financial writer. She is a frequent contributor to "Technical Analysis of Stocks and Commodities" magazine and "Traders.com Advantage" as well as other financial publications.
PRINT THIS ARTICLE
PSYCHOLOGY
Overcoming Overconfidence Bias
12/04/14 05:04:49 PMby Stella Osoba, CMT
Overconfidence is a cognitive bias which results in our overestimating our abilities to perform a skill or task. In so doing, we see ourselves as better than average and we rate our abilities higher than others would rate us. In financial markets, this bias most often manifests itself in traders as aggressive trading or as an increase in trading volume. It is important, therefore, that we recognize this bias and find ways to effectively minimize its effects on our trading.
Position: N/A
| Cognitive biases of which overconfidence is one, are systemic errors in our perception of the world. Overconfidence in our abilities as traders can happen after we have had a string of successful trades, or after we have acquired some new technical tool which has been successfully backtested, or for any number of reasons. This cognitive bias manifests itself when we start to believe in our superior ability to beat the market. Overconfidence then blinds us to our limitations, it leads us to believe that what we see is all there is and that our information about the markets is more important than it is, or that we are better able to interpret that information. We will then often fail to realize when we are at an informational disadvantage, when our ability to interpret market clues is deficient, or when we need to step back and wait for the market to give us clues. |
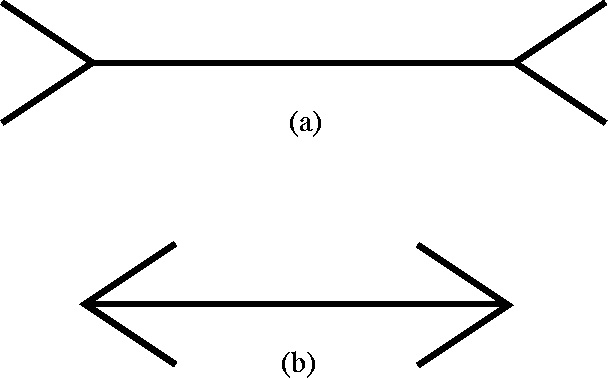
| Our brains can, and often will play tricks on us. The Muller-Lyer illusion proved this. It showed what we see may not in-fact be all that there is. The image in Figure 1 shows two straight lines. At first glance, line (a) appears to be longer than line (b). But this is an optical illusion caused by the direction of the arrows on either end of the lines. In fact, taking a ruler to the lines will show that both are exactly the same length. When we become aware of this fact, even though our minds continue to see line (a) as the longer line, we adjust our mental commentary to take into account the limitations in our perceptions. |
|
| |
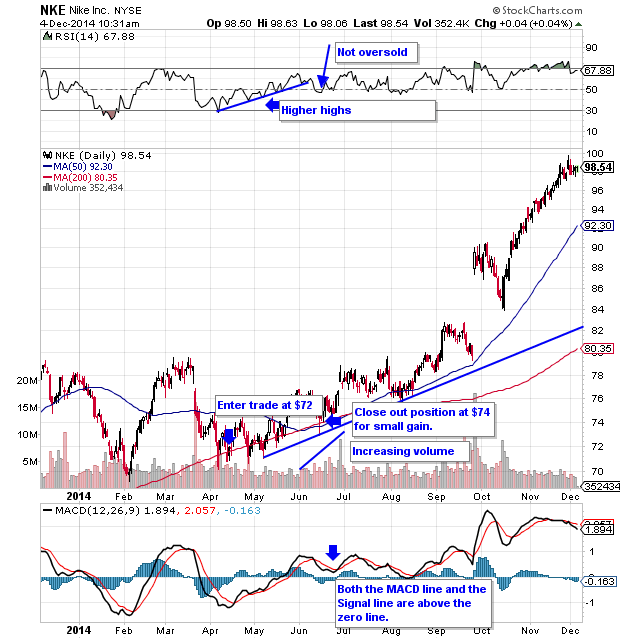
| We can often recognize overconfidence when we start to over trade. We trade more aggressively and increase trading volume. Sometimes we exit perfectly good trades because we exaggerate our abilities to know the future. For instance, in the chart of Nike (NKE) in Figure 2 we watch as NKE pulls back from its recent highs. It makes a low at $70.17 on April 7, 2014 and we enter for a long position at $72 on April 14, 2014. Price advances to a high of $74.40 on April 23, 2014, but then pulls back again and stalls at the 200-day moving average (MA). The 50-day MA turns down also. Concerned, we watch as price tracks the 200-day MA and then moves to the upside on lower closes before forming a lower high and pulling back once more to the 200-day MA. The 50-day MA slips under the 200-day MA and we close out our position at $74 on July 17, 2014 for a small gain because we know that NKE is headed for trouble. |
|
| Figure 2. Daily Chart Of Nike, Inc (NKE). Look at the big picture before making trading decisions. |
| Graphic provided by: StockCharts.com. |
| |
| In assuming our superior ability to beat the market or interpret the signals we are familiar with, we had completely omitted other signals that told a different story. We managed to overlook that from the time we entered our position, prices had not made lower lows. The long bottom shadows on the daily candlesticks should have been interpreted as a positive sign. It meant that shares were closing above their daily lows because demand was coming in to pick up supply. The falling 50-day MA was not a forecast of what was going to happen. Moving average lines are a lagging indicator. They usually reflect what has happened. In this case the sag in the 50-day MA was a reflection that prices had been lower over the past 50 days and would have taken into account the sharp drop from March 19 to March 27, 2014 and also the further lows up until April 8, 2014 which we would have seen if we looked back at the chart. That the 200-day MA was still rising was a good sign. If we looked at the relative strength index (RSI), we would have seen more evidence not to be hasty in getting out of the trade. RSI was making higher lows and was not in overbought territory. The MACD was well above the zero line which was a positive sign. Even though in the short-term, the signal line was above the MACD line which was negative, the combination of other positive factors outweighed this signal. A signal is only a sign to look for confirmation. In this case there was no other confirmation that the shares of NKE were in trouble. All the other signals were positive, even volume showed a steady increase into a subsequent rise and gap up in prices. |
| Overconfidence can make us think that we know more than we do, or that our abilities are superior. This can blind us to what is really going on. With hindsight, it seems pretty clear that NKE would have been a good position to hold for a long trade, but in the moment, at the mercy of our emotions and unrecognized biases, we could easily be tempted to make unwise decisions based on faulty analysis. We must therefore try to keep at the forefront of our analysis, the acceptance that what we see might not be all there is to see. |
Stella Osoba is a trader and financial writer. She is a frequent contributor to "Technical Analysis of Stocks and Commodities" magazine and "Traders.com Advantage" as well as other financial publications.
| E-mail address: | stellaosoba@gmail.com |
Click here for more information about our publications!
Comments

Request Information From Our Sponsors
- StockCharts.com, Inc.
- Candle Patterns
- Candlestick Charting Explained
- Intermarket Technical Analysis
- John Murphy on Chart Analysis
- John Murphy's Chart Pattern Recognition
- John Murphy's Market Message
- MurphyExplainsMarketAnalysis-Intermarket Analysis
- MurphyExplainsMarketAnalysis-Visual Analysis
- StockCharts.com
- Technical Analysis of the Financial Markets
- The Visual Investor
- VectorVest, Inc.
- Executive Premier Workshop
- One-Day Options Course
- OptionsPro
- Retirement Income Workshop
- Sure-Fire Trading Systems (VectorVest, Inc.)
- Trading as a Business Workshop
- VectorVest 7 EOD
- VectorVest 7 RealTime/IntraDay
- VectorVest AutoTester
- VectorVest Educational Services
- VectorVest OnLine
- VectorVest Options Analyzer
- VectorVest ProGraphics v6.0
- VectorVest ProTrader 7
- VectorVest RealTime Derby Tool
- VectorVest Simulator
- VectorVest Variator
- VectorVest Watchdog