HOT TOPICS LIST
- MACD
- Fibonacci
- RSI
- Gann
- ADXR
- Stochastics
- Volume
- Triangles
- Futures
- Cycles
- Volatility
- ZIGZAG
- MESA
- Retracement
- Aroon
INDICATORS LIST
LIST OF TOPICS
PRINT THIS ARTICLE
by Koos van der Merwe
Much has been written about Fibonacci numbers and ratios, and many believe they are golden -- that charts will always turn at a Fibonacci number or ratio. Are they?
Position: Hold
Koos van der Merwe
Has been a technical analyst since 1969, and has worked as a futures and options trader with First Financial Futures in Johannesburg, South Africa.
PRINT THIS ARTICLE
FIBONACCI
Fibonacci Ratios and the S&P 500 Monthly Index
11/08/02 09:01:24 AMby Koos van der Merwe
Much has been written about Fibonacci numbers and ratios, and many believe they are golden -- that charts will always turn at a Fibonacci number or ratio. Are they?
Position: Hold
| Beginning with a little background, in 1180 Leonardo Fibonacci discovered the relationship of what are now referred to as Fibonacci numbers while studying the Great Pyramid of Giza in Egypt. He found a sequence of numbers in which each successive number was the sum of the two previous numbers. For example, 1, 1, 2, 3, 5, 8, 13, 21, 34, 55, 89, 144, 233, 377, 610, and so on. |
| These numbers possess an intriguing set of interrelationships. Any given number is approximately 1.618 times the preceding number and any given number is approximately 0.618 times the following number. When you look at the shell of a snail, or the arms of a galaxy, the spirals are the distance of a fibonacci ratio from each other, hence their mysticism. |

|
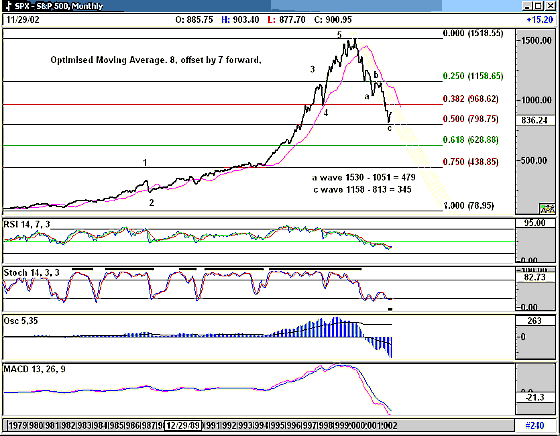
| S&P 500 Monthly Index |
| Graphic provided by: AdvancedGET. |
| |
| Occasionally, such as in the S&P 500 chart above, Fibonacci ratios can be placed perfectly onto support and resistance lines. In this case, you cannot ignore the obvious. In the above chart, the index has bounced off the 50 percent Fibonacci ratio level. My start level was 73 on August 30, 1974, the bottom of the 1969 - 74 bear market. My top is the 1520.88 level from August 31, 2000. At 796.94, the index has touched the 50 percent Fibonacci level, which is significant, especially when you consider that the RSI is very oversold; the stochastic is oversold and turning; and the MACD 13,26,9 is still pointing down. For the Elliott fans, I have suggested an abc retracement of a 5-impulse wave rise. This looks very feasible, except for one thing, a 'c' wave is usually, but not always, a 5-wave down, and the monthly chart does not show this. I have, on the odd occasion, known a c-wave failure. That is when the c-wave is not a 5-wave down, and is also shorter than the a-wave, as shown above. This suggests tremendous strength ahead for the bull market to come. |
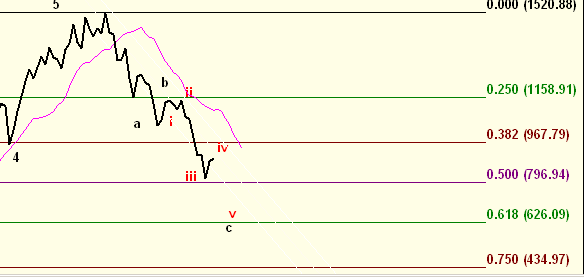
On the other hand, an alternate strategy can be found up every Elliottician's sleeve. My alternate count is that this upward correction could be the fourth wave of the 5-wave down (see next chart), with waves i, ii, iii, and the up-move as iv. This means that v could be at the 0.618 level or 626.09 with the C wave being 532 in length (1158 – 626 = 532). which is far more feasible than the 361 (1158-797 = 361) of the first chart. By that time we could also see a turn in the indicators and oscillators, confirming a buy signal and the end of the bear run. Alternate Elliott wave count |
| Of course we all prefer the first chart, because the second chart shows that the bear market is not yet over. But with all of us being optimists, we would all like to believe that the market has turned bull. Time will tell which count is correct. |
Has been a technical analyst since 1969, and has worked as a futures and options trader with First Financial Futures in Johannesburg, South Africa.
| Address: | 3256 West 24th Ave |
| Vancouver, BC | |
| Phone # for sales: | 6042634214 |
| E-mail address: | petroosp@gmail.com |
Click here for more information about our publications!
Comments
Date: 11/07/02Rank: 4Comment:
Date: 11/09/02Rank: 1Comment:
Date: 11/12/02Rank: 4Comment: nice ....
on this hand..... on the other hand
is vol then cheap...... because of lack of directional clarity
Date: 11/30/02Rank: 2Comment:
Date: 12/16/02Rank: 5Comment:

|

Request Information From Our Sponsors
- StockCharts.com, Inc.
- Candle Patterns
- Candlestick Charting Explained
- Intermarket Technical Analysis
- John Murphy on Chart Analysis
- John Murphy's Chart Pattern Recognition
- John Murphy's Market Message
- MurphyExplainsMarketAnalysis-Intermarket Analysis
- MurphyExplainsMarketAnalysis-Visual Analysis
- StockCharts.com
- Technical Analysis of the Financial Markets
- The Visual Investor
- VectorVest, Inc.
- Executive Premier Workshop
- One-Day Options Course
- OptionsPro
- Retirement Income Workshop
- Sure-Fire Trading Systems (VectorVest, Inc.)
- Trading as a Business Workshop
- VectorVest 7 EOD
- VectorVest 7 RealTime/IntraDay
- VectorVest AutoTester
- VectorVest Educational Services
- VectorVest OnLine
- VectorVest Options Analyzer
- VectorVest ProGraphics v6.0
- VectorVest ProTrader 7
- VectorVest RealTime Derby Tool
- VectorVest Simulator
- VectorVest Variator
- VectorVest Watchdog
