

HOT TOPICS LIST
- MACD
- Fibonacci
- RSI
- Gann
- ADXR
- Stochastics
- Volume
- Triangles
- Futures
- Cycles
- Volatility
- ZIGZAG
- MESA
- Retracement
- Aroon
INDICATORS LIST
LIST OF TOPICS
PRINT THIS ARTICLE
by Donald W. Pendergast, Jr.
Buying a new 52-week high can make sense if numerous market and technical dynamics properly converge.
Position: N/A
Donald W. Pendergast, Jr.
Freelance financial markets writer and online publisher of the Trendzetterz.com S&P 500 Weekly Forecast service.
PRINT THIS ARTICLE
KELTNER CHANNELS
CarMax, Inc.: Bullish Momentum At 52-Week Highs
12/11/14 04:55:27 PMby Donald W. Pendergast, Jr.
Buying a new 52-week high can make sense if numerous market and technical dynamics properly converge.
Position: N/A
| Some traders thrive in momentum-chasing trading environments, while others seek to time reversal entries as extreme momentum finally exhausts; it takes a lot of experience to know the difference between these two market scenarios, but when you finally begin to 'get it' the profits may come easier. Here's a closer look at a rational 'buy a new high' trade setup in shares of CarMax, Inc. (KMX), one that has many technicians agreeing that its line of least resistance is toward higher prices soon. |
|
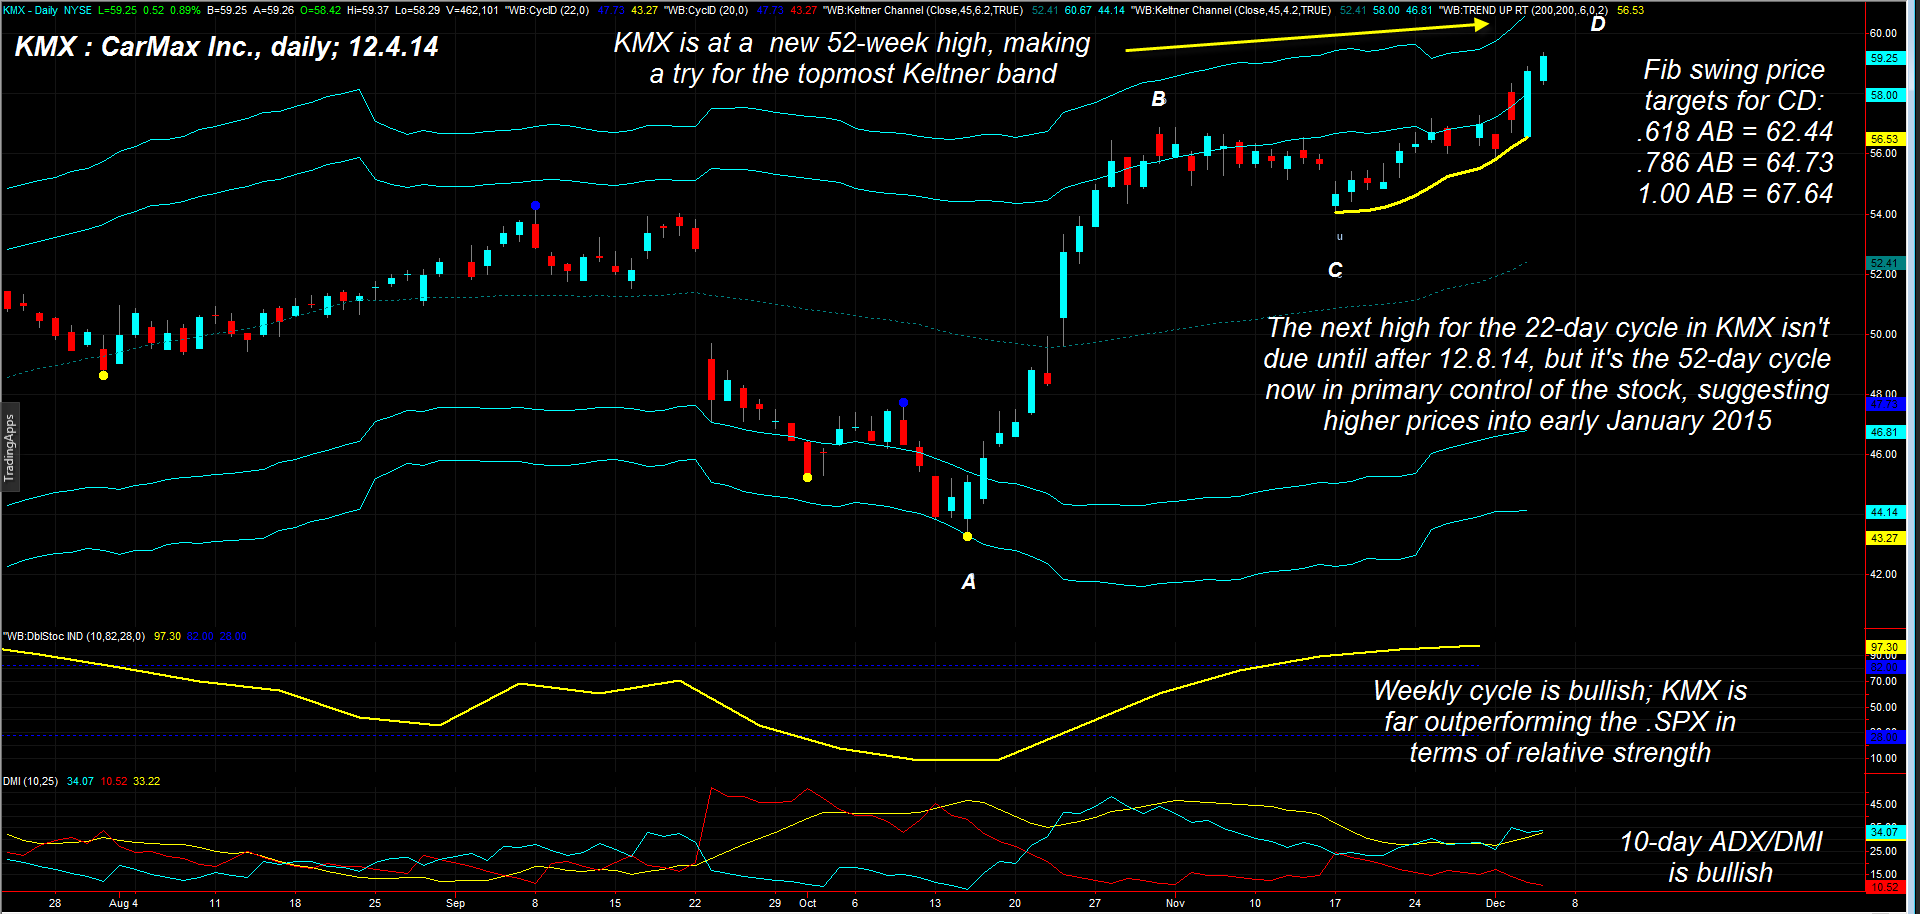
| Figure 1. Up Swings. CarMax Inc. (KMX) may be in the early stages of a powerful bullish upswing; conservative Fibonacci-based price targets for the move are at 62.44, 64.73 and 67.64. |
| Graphic provided by: TradeStation. |
| Graphic provided by: ProfitTrader7 from www.walterbressert.com. |
| |
| KMX displays a very consistent pattern of tradable swing/trend moves over many years of daily historical data; some swings are the garden variety (three to six bars), while at other times multi-week trends appear, the kind that can make good money without a lot of effort on the part of the trader. Presently, KMX is attempting to power a swing CD higher, one that has the following potential (and conservative) price targets (Figure 1): 1. .618 swing AB = 62.44 2. .786 swing AB = 64.73 3. 1.00 swing AB = 67.64 Analysis of price cycles, momentum, and trend supports the validity of those targets, too: A. The 10-day average directional movement index (ADX) is rising and the DMI lines are in a bullish spread in relation to the ADX level of 33.52. B. The correction of swing BC was relatively shallow in relation to the ferocious power displayed as swing AB rocketed up from the mid-October lows; the so-called "smart money" wasted little time in getting positioned for this new up leg in progress. C. The weekly cycle oscillator (yellow) is confirming the bullish move of the past seven weeks. D. The current swing higher has decisively cleared the inner Keltner band and may now be on track to target the extreme upper band in the weeks ahead. E. KMX is outperforming the S&P 500 index (.SPY, SPY) over the past 4-, 13-, 26-week periods and is also doing much better than the index on a year-to-date basis. F. Based on the dominant 22-bar cycle, KMX is not expected to top out until after December 8, 2014 and the next 22-bar cycle low is not due until approximately December 16, 2014. However, it's the 52-bar cycle that is doing the bulk of the heavy lifting now in the stock, meaning that this current swing could extend higher into early 2015 before exhausting. G. The trend trailing stop (yellow line) also confirms the bullish cycles driving the stock higher. The stop loss level is a 56.53 based on Wednesday's close (December 3, 2014) and is still rising. |
|
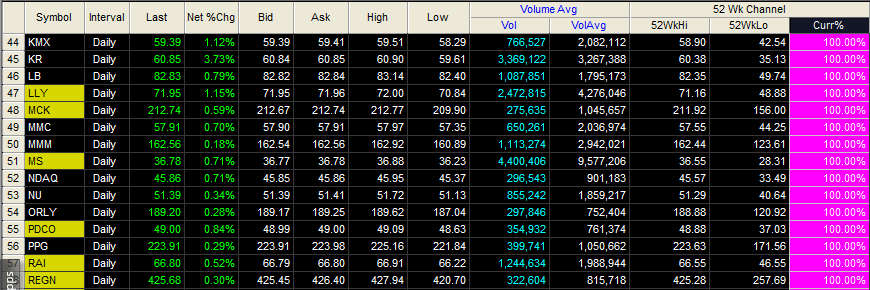
| Figure 2. 52-Week Highs. A snapshot of various large cap stocks hitting new 52-week highs on Thursday December 4, 2014. |
| Graphic provided by: TradeStation. |
| Graphic provided by: TradeStation 9.1 RadarScreen. |
| |
| Given such bullish dynamics, one low-risk way to play the stock is to put on a January 2015 $57.50 covered call; the bid-ask spread is acceptable, open interest is 639 contracts and daily time decay comes in at $3 per day/per contract. Being an in-the-money (ITM) covered call, traders will also have a bit of a built-in cushion against minor adverse price moves in the stock prior to option expiration on the third Friday of January 2015. Assuming a call credit of about $3.40 and a stock purchase price of 59.30, a trader could profit by as much as $145 per covered call (before commissions and slippage) if not stopped out before expiration. Unless there is a strong correction in the S&P 500 index sometime between now and January 16, 2015, the probabilities favor a successful outcome for this trade; keep your account risk at 2% or less and remember to trade wisely until we meet here again. |
Freelance financial markets writer and online publisher of the Trendzetterz.com S&P 500 Weekly Forecast service.
| Title: | Market consultant and writer |
| Company: | Trendzetterz |
| Address: | 81 Hickory Hollow Drive |
| Crossville, TN 38555 | |
| Phone # for sales: | 904-303-4814 |
| Website: | trendzetterz.com |
| E-mail address: | support@trendzetterz.com |
Traders' Resource Links | |
| Trendzetterz has not added any product or service information to TRADERS' RESOURCE. | |
Click here for more information about our publications!
PRINT THIS ARTICLE

Request Information From Our Sponsors
- StockCharts.com, Inc.
- Candle Patterns
- Candlestick Charting Explained
- Intermarket Technical Analysis
- John Murphy on Chart Analysis
- John Murphy's Chart Pattern Recognition
- John Murphy's Market Message
- MurphyExplainsMarketAnalysis-Intermarket Analysis
- MurphyExplainsMarketAnalysis-Visual Analysis
- StockCharts.com
- Technical Analysis of the Financial Markets
- The Visual Investor
- VectorVest, Inc.
- Executive Premier Workshop
- One-Day Options Course
- OptionsPro
- Retirement Income Workshop
- Sure-Fire Trading Systems (VectorVest, Inc.)
- Trading as a Business Workshop
- VectorVest 7 EOD
- VectorVest 7 RealTime/IntraDay
- VectorVest AutoTester
- VectorVest Educational Services
- VectorVest OnLine
- VectorVest Options Analyzer
- VectorVest ProGraphics v6.0
- VectorVest ProTrader 7
- VectorVest RealTime Derby Tool
- VectorVest Simulator
- VectorVest Variator
- VectorVest Watchdog