

HOT TOPICS LIST
- MACD
- Fibonacci
- RSI
- Gann
- ADXR
- Stochastics
- Volume
- Triangles
- Futures
- Cycles
- Volatility
- ZIGZAG
- MESA
- Retracement
- Aroon
INDICATORS LIST
LIST OF TOPICS
PRINT THIS ARTICLE
by Donald W. Pendergast, Jr.
The wholesale dumping of BPZ Resources, Inc. shares may be setting the stage for a tradable bullish reversal.
Position: N/A
Donald W. Pendergast, Jr.
Freelance financial markets writer and online publisher of the Trendzetterz.com S&P 500 Weekly Forecast service.
PRINT THIS ARTICLE
CHART ANALYSIS
BPZ: Panic Selling Near All-Time Lows
12/09/14 03:42:37 PMby Donald W. Pendergast, Jr.
The wholesale dumping of BPZ Resources, Inc. shares may be setting the stage for a tradable bullish reversal.
Position: N/A
| There are downtrends in individual stocks and then there are the kind of downtrends that are simply mind-shattering in their length and depth, and that's the sort of downward spiral that has engulfed shares of BPZ Resources, Inc. (BPZ) since they peaked at nearly $30.00 per share in July 2008. Incredibly, the stock still averages around a million shares per day in trading volume despite trading near twenty cents — a decline of more than 99% in the past 6.5 years. While few, if any, analysts are forecasting a new bull market for BPZ anytime soon, its intraday and daily charts are suggesting that the worst of the selling is at hand as daily volumes and ranges drastically expand near an anticipated wave 5 termination zone. Here's a closer look now. |
|
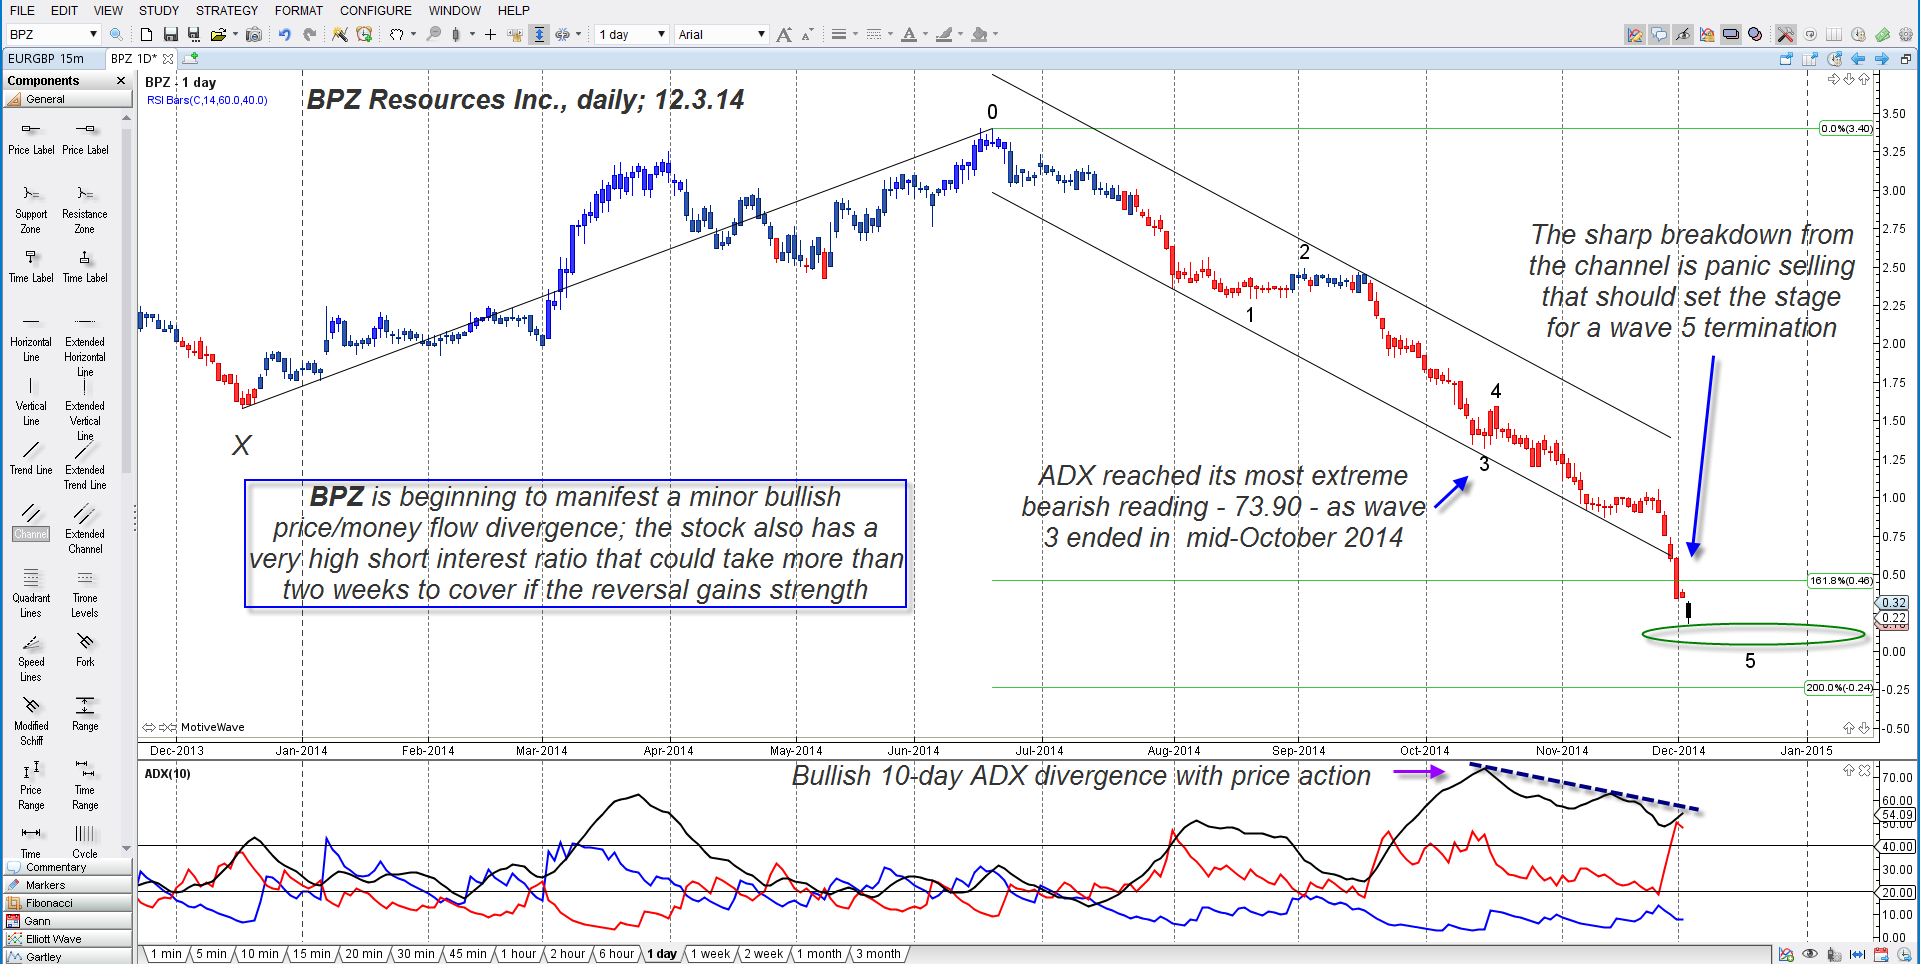
| Figure 1. Daily Chart. BPZ Resources Inc. (BPZ) may be at or near the terminal phase of a substantial five-wave Elliott impulse pattern. Note the bullish divergence on the 10-day ADX indicator. |
| Graphic provided by: MotiveWave Ultimate from www.motivewave.com. |
| |
| After a 99 percent-plus wasting since its summer 2008 high, it's the understatement of the year to suggest that there aren't many investment advisors who are telling their clients to load up on shares of BPZ, a stock currently trading at .25 (but which is up by 35% from the recent low of .18), but savvy technicians might just be inclined to allocate a small amount of risk capital into a potential bullish reversal play in the stock now, for the following reasons: 1. Daily (Figure 1) and intraday (Figure 2) charts confirm massive blowoff selling climaxes — this is where the last of the bulls finally give up hope and dump their shares enmasse, usually right before the ultimate bottom is in place. 2. BPZ is at or near the termination of a complete five wave impulse pattern on its daily chart. 3. Near-term Chaikin Money Flow histograms (CMF)(8, 13) reveal that some accumulation is already underway. 4. BPZ has a high short interest ratio, one that would take more than two weeks for the bears to cover; shorts sellers must buy back the shares they have borrowed, increasing the odds for a sustained rally until such positions are closed out. 5. The 10-day Average Directional Movement index (ADX) reached its zenith at nearly 74.00 as the wave three down ended in mid-October 2014. Since then the ADX has made two lower highs even as BPZ went on to make new lows, and this is normally interpreted as a bullish divergence setup prior to a reversal/bottoming phase. 6. On the 65-minute chart, note the move back across the regression channel midline; watch for a close back above the channel line to confirm that the first stage of the reversal is complete. Given all of the above, probabilities suggest that BPZ is much closer to the end of its sell-off than its beginning, even if for no other reason that the stock only has 25 cents to go before reaching a theoretical value of zero. |
|
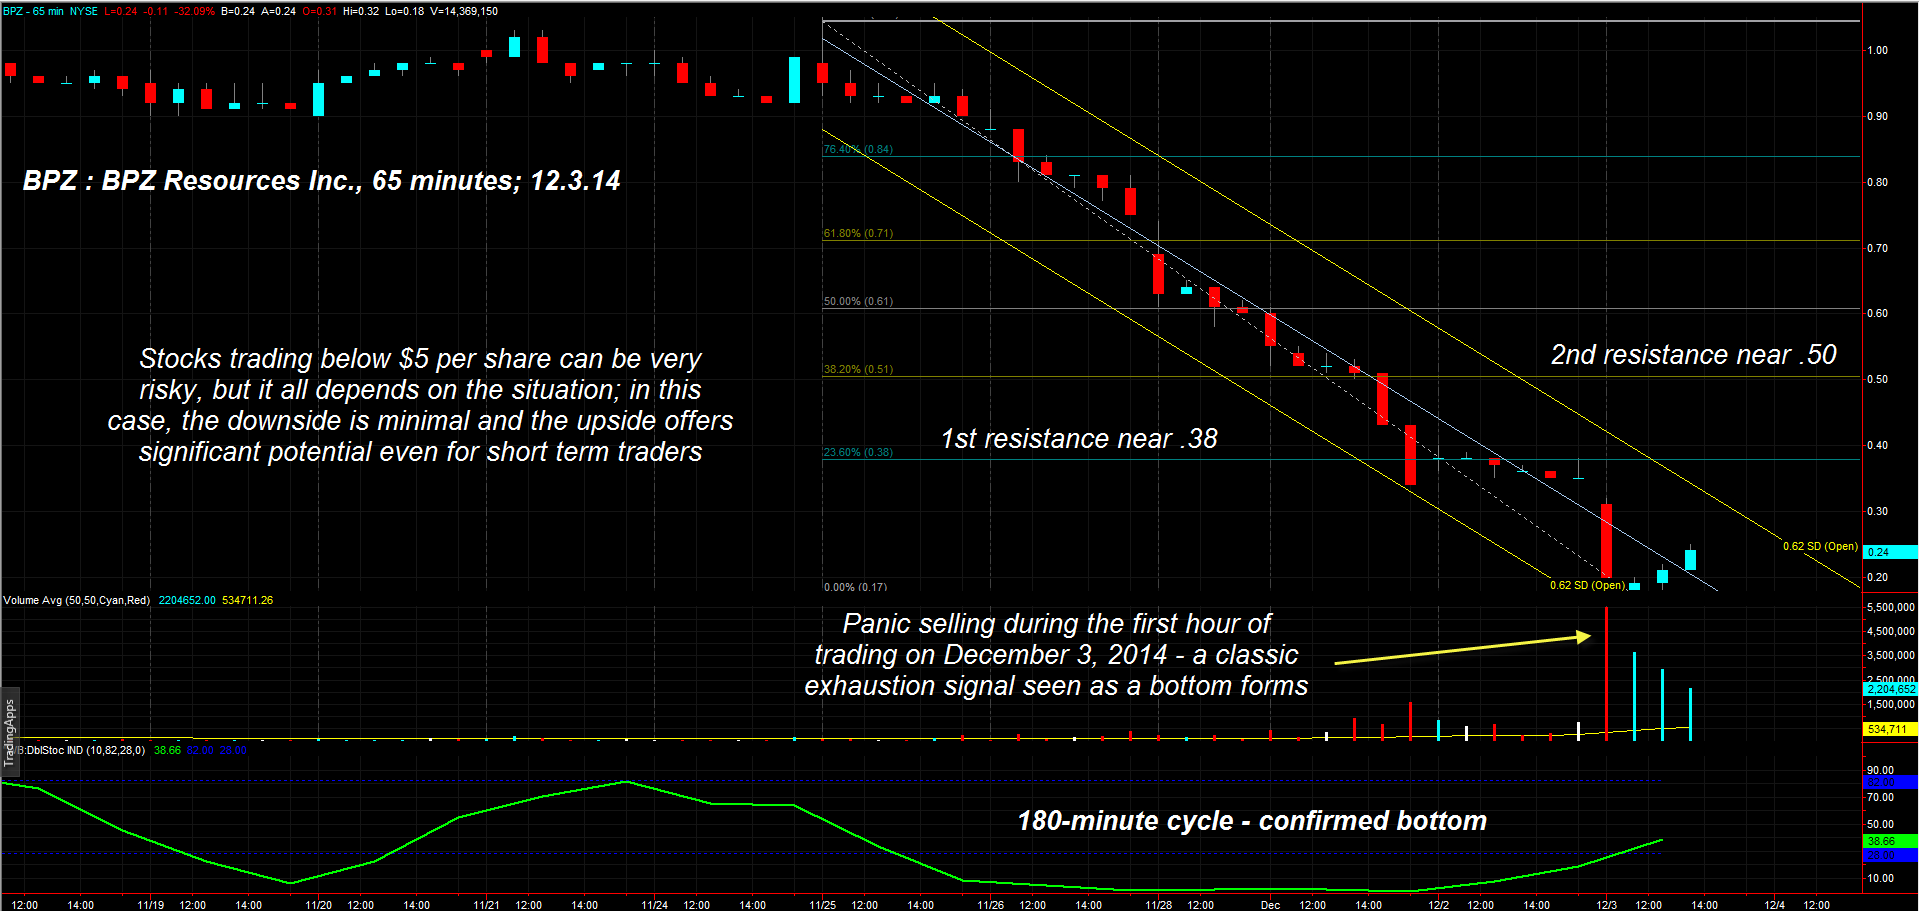
| Figure 2. Intraday Chart. BPZ prints a 'blowoff' volume climax during the first hour of trading on December 3, 2014. |
| Graphic provided by: TradeStation. |
| Graphic provided by: ProfitTrader7 from www.walterbressert.com. |
| |
| This sets up a rare and interesting bullish reversal play in BPZ: * A long entry here has a maximum risk of .25 per share if no stop loss is used. * Based on the first resistance level at .38, an initial stop at .18 (the new swing low) and an entry price of .25 the risk/reward ratio comes in at nearly 2 to 1. * Using the second resistance as a target, the risk/reward ratio improves to better than 3 to 1. * Traders could take half their profits at resistance 1 and then try to hold on for more gains at resistance 2; a three-bar trailing stop of the hourly lows might offer a sensible, logical way to manage the position, should it move higher as anticipated. If you do take a shot at this potential reversal play be sure to use an extra-small amount of your risk capital, and for obvious reasons. BPZ has an excellent chance of making it to at least resistance area 1 (.38) and an above-average chance of hitting fifty cents per share before its next 20-bar cycle high prints, so this may very well be a long reversal play worth considering. Trade wisely until we meet here again. |
Freelance financial markets writer and online publisher of the Trendzetterz.com S&P 500 Weekly Forecast service.
| Title: | Market consultant and writer |
| Company: | Trendzetterz |
| Address: | 81 Hickory Hollow Drive |
| Crossville, TN 38555 | |
| Phone # for sales: | 904-303-4814 |
| Website: | trendzetterz.com |
| E-mail address: | support@trendzetterz.com |
Traders' Resource Links | |
| Trendzetterz has not added any product or service information to TRADERS' RESOURCE. | |
Click here for more information about our publications!
PRINT THIS ARTICLE

Request Information From Our Sponsors
- StockCharts.com, Inc.
- Candle Patterns
- Candlestick Charting Explained
- Intermarket Technical Analysis
- John Murphy on Chart Analysis
- John Murphy's Chart Pattern Recognition
- John Murphy's Market Message
- MurphyExplainsMarketAnalysis-Intermarket Analysis
- MurphyExplainsMarketAnalysis-Visual Analysis
- StockCharts.com
- Technical Analysis of the Financial Markets
- The Visual Investor
- VectorVest, Inc.
- Executive Premier Workshop
- One-Day Options Course
- OptionsPro
- Retirement Income Workshop
- Sure-Fire Trading Systems (VectorVest, Inc.)
- Trading as a Business Workshop
- VectorVest 7 EOD
- VectorVest 7 RealTime/IntraDay
- VectorVest AutoTester
- VectorVest Educational Services
- VectorVest OnLine
- VectorVest Options Analyzer
- VectorVest ProGraphics v6.0
- VectorVest ProTrader 7
- VectorVest RealTime Derby Tool
- VectorVest Simulator
- VectorVest Variator
- VectorVest Watchdog