HOT TOPICS LIST
- MACD
- Fibonacci
- RSI
- Gann
- ADXR
- Stochastics
- Volume
- Triangles
- Futures
- Cycles
- Volatility
- ZIGZAG
- MESA
- Retracement
- Aroon
INDICATORS LIST
LIST OF TOPICS
PRINT THIS ARTICLE
by Koos van der Merwe
Pharmaceutical companies have been worth looking at since the Affordable Health Care Act was introduced.
Position: Accumulate
Koos van der Merwe
Has been a technical analyst since 1969, and has worked as a futures and options trader with First Financial Futures in Johannesburg, South Africa.
PRINT THIS ARTICLE
ELLIOTT WAVE
A Look At Eli Lilly
12/05/14 05:08:23 PMby Koos van der Merwe
Pharmaceutical companies have been worth looking at since the Affordable Health Care Act was introduced.
Position: Accumulate
| Eli Lilly (LLY) is a pharmaceutical company well known and respected in the medical profession. After numerous setbacks, the company has mounted another assault on Alzheimer's launching a study of its BACE drug with newly partnered AstraZeneca. Most analysts view the Alzheimer's program as very high risk, with limited odds of success, but they also realize that any drug that offers even a sliver of hope to patients would be worth billions in annual sales. Buying shares in any pharmaceutical company that develops new drugs is risky, but it is often worth the risk. |

|
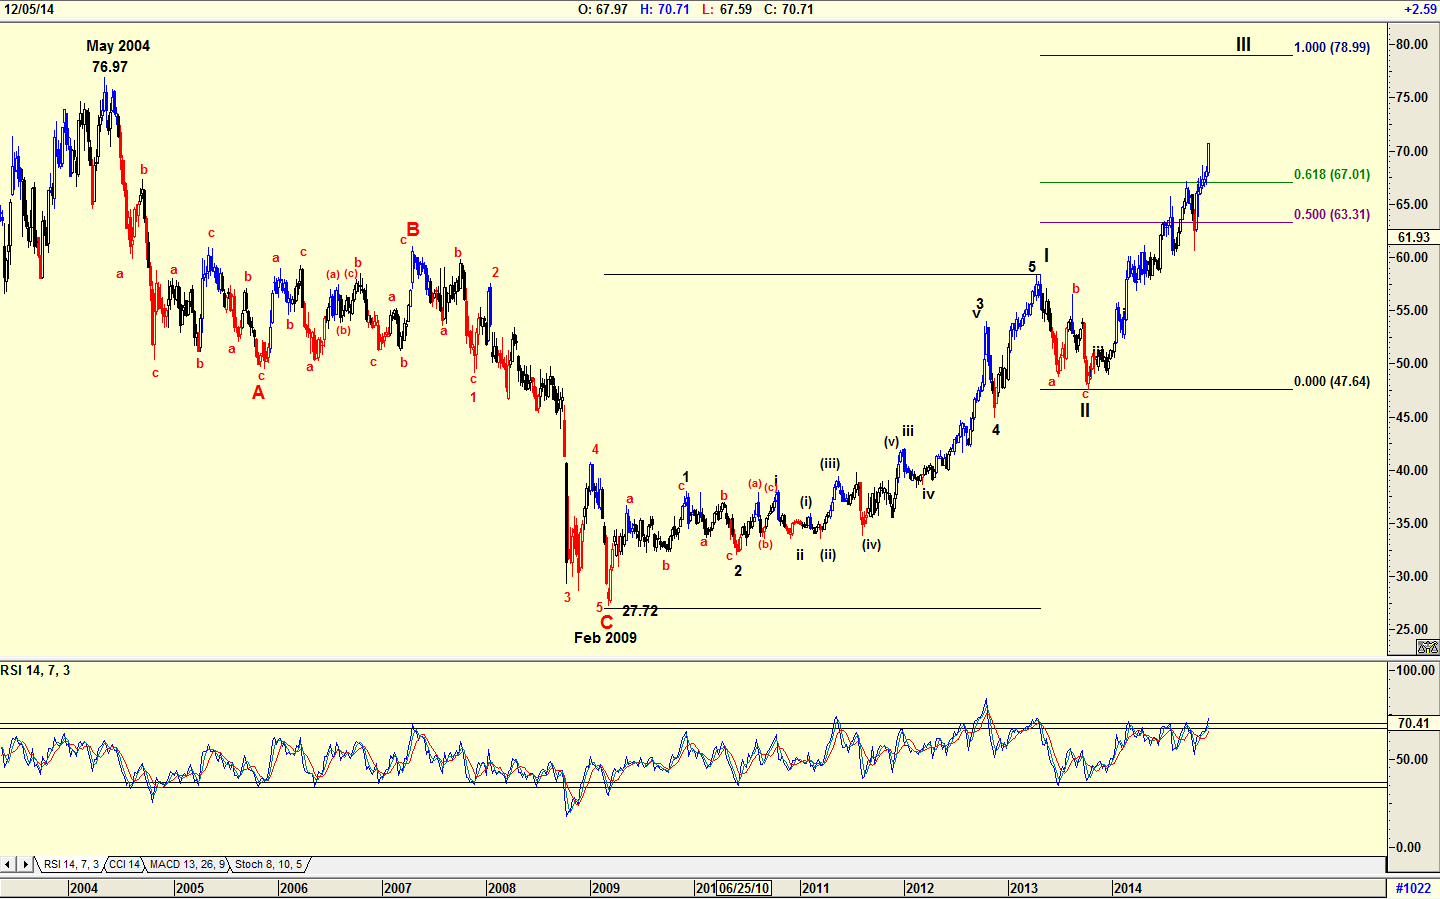
| Figure 1. Weekly Chart Of Eli Lilly (LLY). The Elliott Wave count suggests that the stock price is in a Wave III bull trend. |
| Graphic provided by: AdvancedGET. |
| |
| The chart in Figure 1 is a weekly chart of LLY with a complicated Elliott Wave count suggesting that the share price is in a WAVE III bull trend. A wave three should be equal to or greater than a wave one, which means that the target for the WAVE III should be $78.99, as shown on the chart. However, there are instances when a WAVE III is less than a WAVE I. Should that happen, the WAVE V will be less than WAVE III. This pattern occurs very seldom, but the probability that it could occur should never be swept under the carpet. Note the relative strength index (RSI) which is at overbought levels, but has not yet given a major sell signal. |

|
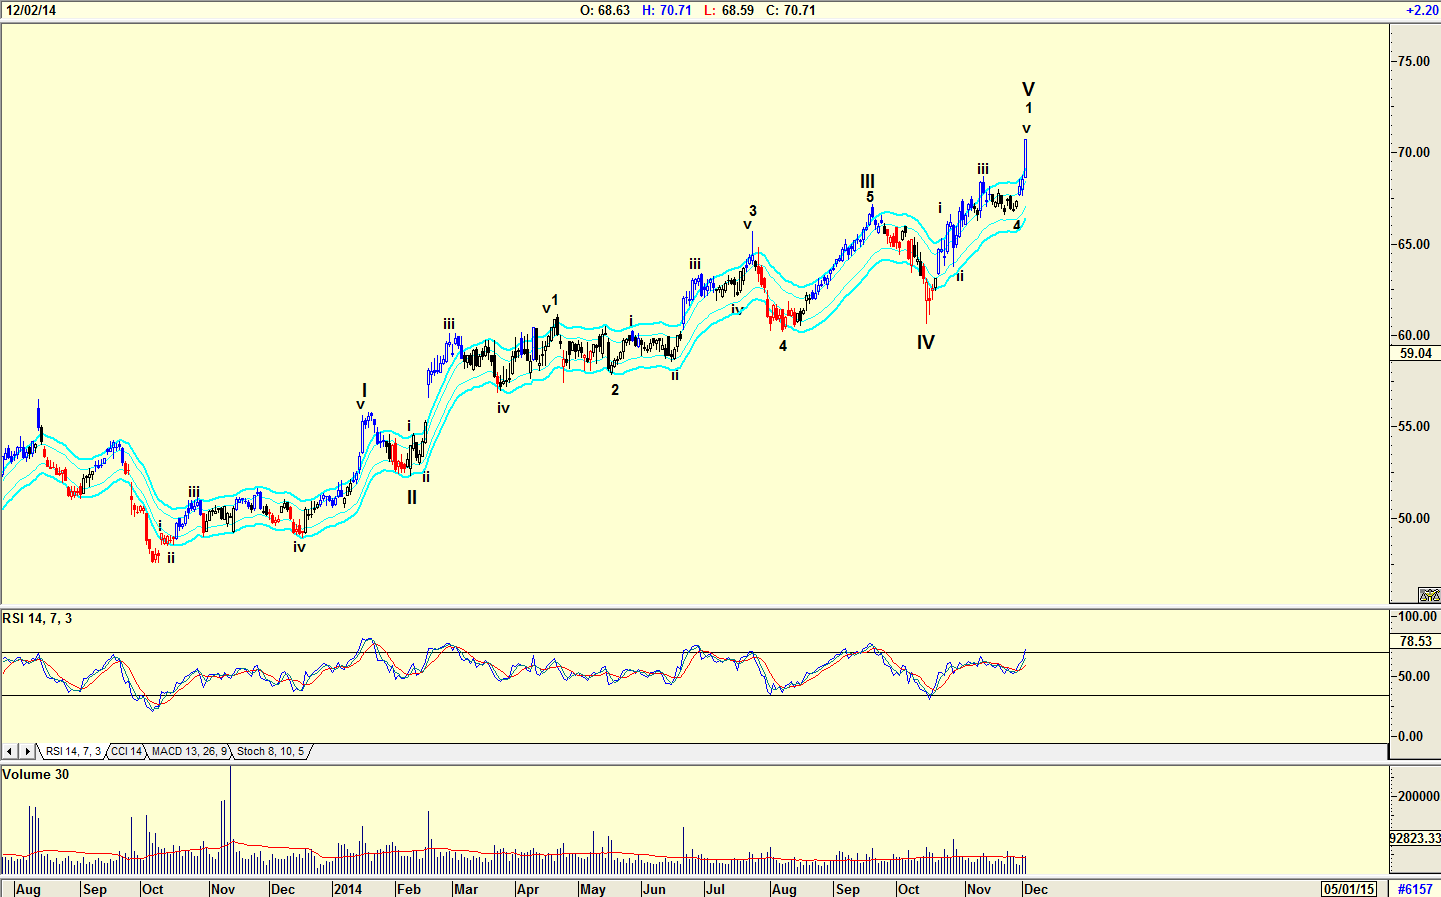
| Figure 2. Daily Chart With Elliott Wave Count. Here you see that the share price is in a Wave V. The RSI is at overbought levels but has not suggested a sell signal. |
| Graphic provided by: AdvancedGET. |
| |
| The chart in Figure 2 is a daily chart of LLY with an Elliott Wave count suggesting that the share price is in a WAVE V. The RSI is at overbought levels, but has not suggested a sell signal. This means that WAVE V could go higher, which would bring it in line with the weekly chart of Figure 1. Volume is testing the volume average, a 30-period moving average of the volume, which is a sign of strength. I would be a buyer of LLY shares on any correction, believing that the share has to rise further in a WAVE III. However, this would be a short-term hold, with close stops. Investors on the other hand, could wait for WAVE IV to occur, and only then buy the share for a long-term hold into WAVE V. |
Has been a technical analyst since 1969, and has worked as a futures and options trader with First Financial Futures in Johannesburg, South Africa.
| Address: | 3256 West 24th Ave |
| Vancouver, BC | |
| Phone # for sales: | 6042634214 |
| E-mail address: | petroosp@gmail.com |
Click here for more information about our publications!
PRINT THIS ARTICLE

Request Information From Our Sponsors
- VectorVest, Inc.
- Executive Premier Workshop
- One-Day Options Course
- OptionsPro
- Retirement Income Workshop
- Sure-Fire Trading Systems (VectorVest, Inc.)
- Trading as a Business Workshop
- VectorVest 7 EOD
- VectorVest 7 RealTime/IntraDay
- VectorVest AutoTester
- VectorVest Educational Services
- VectorVest OnLine
- VectorVest Options Analyzer
- VectorVest ProGraphics v6.0
- VectorVest ProTrader 7
- VectorVest RealTime Derby Tool
- VectorVest Simulator
- VectorVest Variator
- VectorVest Watchdog
- StockCharts.com, Inc.
- Candle Patterns
- Candlestick Charting Explained
- Intermarket Technical Analysis
- John Murphy on Chart Analysis
- John Murphy's Chart Pattern Recognition
- John Murphy's Market Message
- MurphyExplainsMarketAnalysis-Intermarket Analysis
- MurphyExplainsMarketAnalysis-Visual Analysis
- StockCharts.com
- Technical Analysis of the Financial Markets
- The Visual Investor
