

HOT TOPICS LIST
- MACD
- Fibonacci
- RSI
- Gann
- ADXR
- Stochastics
- Volume
- Triangles
- Futures
- Cycles
- Volatility
- ZIGZAG
- MESA
- Retracement
- Aroon
INDICATORS LIST
LIST OF TOPICS
PRINT THIS ARTICLE
by Donald W. Pendergast, Jr.
There's a big difference between a garden-variety overbought situation and an overblown, statistically rare version.
Position: N/A
Donald W. Pendergast, Jr.
Freelance financial markets writer and online publisher of the Trendzetterz.com S&P 500 Weekly Forecast service.
PRINT THIS ARTICLE
KELTNER CHANNELS
RTH: Most Overextended In Thirteen Years
12/03/14 03:22:20 PMby Donald W. Pendergast, Jr.
There's a big difference between a garden-variety overbought situation and an overblown, statistically rare version.
Position: N/A
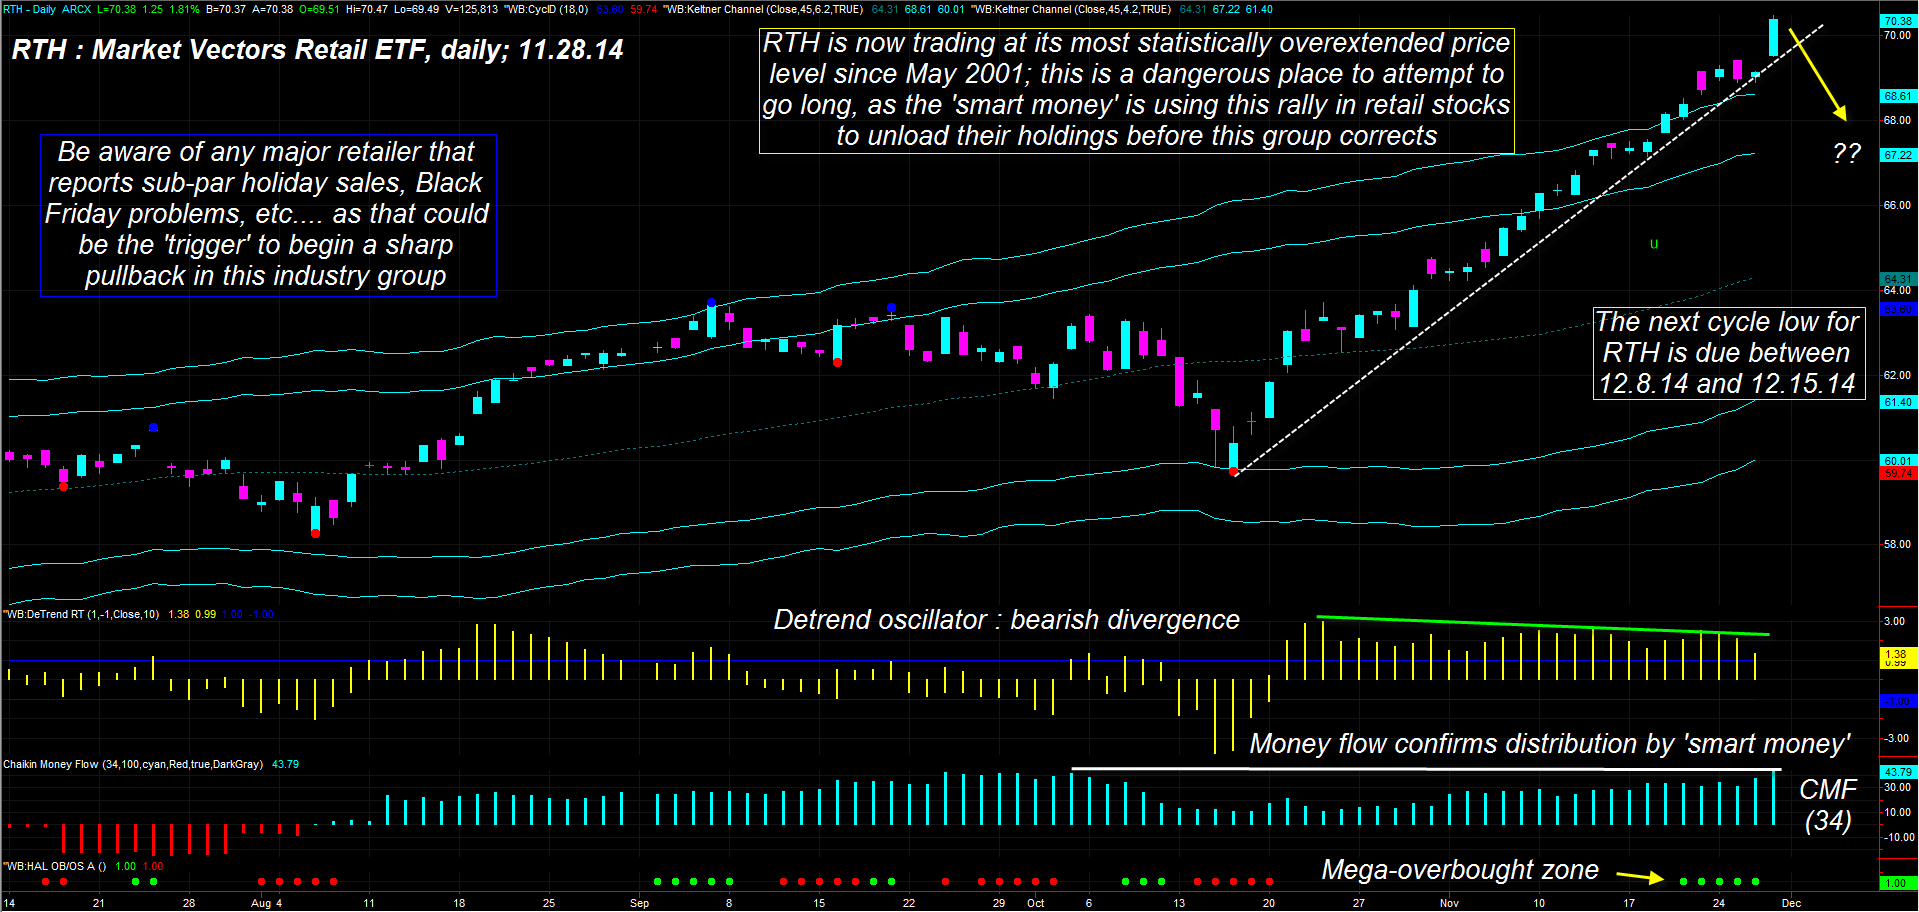
| Retail industry group stocks are still rallying, six weeks after the broad US markets made a major swing low, but the rally is now at an incredibly overbought stage, one so extreme that it has never before been witnessed, especially in the Market Vectors Retail ETF (RTH). Here's a closer look at a near picture-perfect "smart money" distribution play, one that latecomers to this bull run need to be aware of. |
|
| Figure 1. Market Vectors Retail ETF (RTH). Here you see that RTH is now trading at its most extreme, statistically overextended price level since May 2001. |
| Graphic provided by: TradeStation. |
| Graphic provided by: ProfitTrader7 from www.walterbressert.com. |
| |
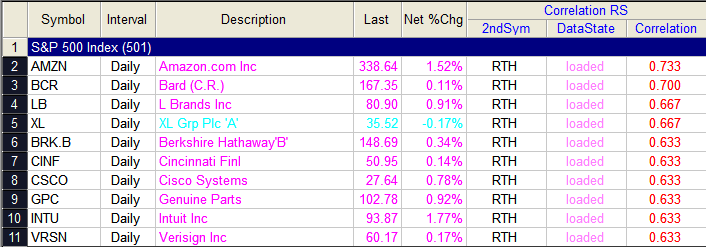
| Like most other stock industry group ETFs, the Market Vectors Retail ETF (RTH) has also enjoyed a strong rally out of the epic, extremely rare 'V' bottom witnessed in mid-October 2014 (Figure 1). Up by nearly 18% in only six and a half weeks, RTH's move higher has caught the attention of fundamental and technical traders alike and as this is written just before the close of trading on Black Friday, the ETF still looks remarkable strong. However, for those traders/investors wondering if they should jump on this bullish, runanway bandwagon now, here are some technical warnings to be keenly aware of: 1. RTH is at its most extreme statistically overextended since it started trading in May 2001; never before has it traded for so many sessions above its extreme upper Keltner channel. 2. The 34-day Chaikin Money Flow histogram (CMF)(34) demonstrates a clear distribution pattern (smart money selling their shares to the latecomers or "dumb money"). 3. The detrend oscillator is also manifesting a clear bearish divergence with price action as it reveals a continual loss of upward momentum. 4. RTH continues to hug its uptrend line as it continues higher; note the lack of volatility during the rally and that it wouldn't take much of an increase in that to bring it back down below the trend line. A trend line break in such an overextended market is usually the precursor to a three-wave corrective pattern. Any bit of bad news from the retail group stocks — especially those most closely correlated to RTH such as AMZN, BCR, BRK.B, CINF. GP, INTU and LB —could be the precipitating event to trigger a correction across the entire group represented by RTH, so be especially careful if you are long retail stocks heading into December 2014. Remember too that the stock market typically discounts bullish news and that all of the bullish optimism for a robust season of holiday sales is probably already factored into RTH's lofty valuation level. Be sure to begin preparing an exit strategy and/or trailing stop or put option protection strategy for any retail group stocks you're currently long; for that matter be sure to protect all of your stock holdings because windfall gains such as seen since mid-October are rare occurrences and always correct the excesses in due time. |
|
| Figure 2. Relative Performance. Here are the S&P 500 index (.SPX, SPY) stocks most closely correlated to RTH over the past three months. |
| Graphic provided by: TradeStation. |
| Graphic provided by: TradeStation 9.1 RadarScreen. |
| |
| Cycles analysis of the S&P 500 (.SPX, SPY) suggests a little more upside is possible before a correction, but the .SPX is right at an important cycles-based resistance level already and could be due for a minor pullback (one to two weeks) before the Santa Claus rally kicks in, running the index higher into mid-January 2015 before a large correction ensues. Trade wisely until we meet here again. |
Freelance financial markets writer and online publisher of the Trendzetterz.com S&P 500 Weekly Forecast service.
| Title: | Market consultant and writer |
| Company: | Trendzetterz |
| Address: | 81 Hickory Hollow Drive |
| Crossville, TN 38555 | |
| Phone # for sales: | 904-303-4814 |
| Website: | trendzetterz.com |
| E-mail address: | support@trendzetterz.com |
Traders' Resource Links | |
| Trendzetterz has not added any product or service information to TRADERS' RESOURCE. | |
Click here for more information about our publications!
PRINT THIS ARTICLE

Request Information From Our Sponsors
- VectorVest, Inc.
- Executive Premier Workshop
- One-Day Options Course
- OptionsPro
- Retirement Income Workshop
- Sure-Fire Trading Systems (VectorVest, Inc.)
- Trading as a Business Workshop
- VectorVest 7 EOD
- VectorVest 7 RealTime/IntraDay
- VectorVest AutoTester
- VectorVest Educational Services
- VectorVest OnLine
- VectorVest Options Analyzer
- VectorVest ProGraphics v6.0
- VectorVest ProTrader 7
- VectorVest RealTime Derby Tool
- VectorVest Simulator
- VectorVest Variator
- VectorVest Watchdog
- StockCharts.com, Inc.
- Candle Patterns
- Candlestick Charting Explained
- Intermarket Technical Analysis
- John Murphy on Chart Analysis
- John Murphy's Chart Pattern Recognition
- John Murphy's Market Message
- MurphyExplainsMarketAnalysis-Intermarket Analysis
- MurphyExplainsMarketAnalysis-Visual Analysis
- StockCharts.com
- Technical Analysis of the Financial Markets
- The Visual Investor