HOT TOPICS LIST
- MACD
- Fibonacci
- RSI
- Gann
- ADXR
- Stochastics
- Volume
- Triangles
- Futures
- Cycles
- Volatility
- ZIGZAG
- MESA
- Retracement
- Aroon
INDICATORS LIST
LIST OF TOPICS
PRINT THIS ARTICLE
by Koos van der Merwe
When a share simply goes up and up and up, when is it time to take profits?
Position: Sell
Koos van der Merwe
Has been a technical analyst since 1969, and has worked as a futures and options trader with First Financial Futures in Johannesburg, South Africa.
PRINT THIS ARTICLE
ELLIOTT WAVE
Is It Time To Sell Pepsico?
12/02/14 05:28:22 PMby Koos van der Merwe
When a share simply goes up and up and up, when is it time to take profits?
Position: Sell
| From October 1990, the share price of PepsiCo Inc. (PEP) has risen from a low of $11.87 to a high of $99.94, obviously with the odd correction on the way up. With the announcement on November 20, 2014 that Sharon Percy Rockefeller, President and Chief Executive Officer has decided not to seek re-election to the company's Board of Directors, the question arises, will her resignation cause the share price to fall? Then, on November 20, 2014 the Board of Directors declared a quarterly dividend of $0.655 to shareholders of record as of December 5, 2014, a 15% increase versus the comparable year-earlier period. Will the share price correct? What do the charts say? |

|
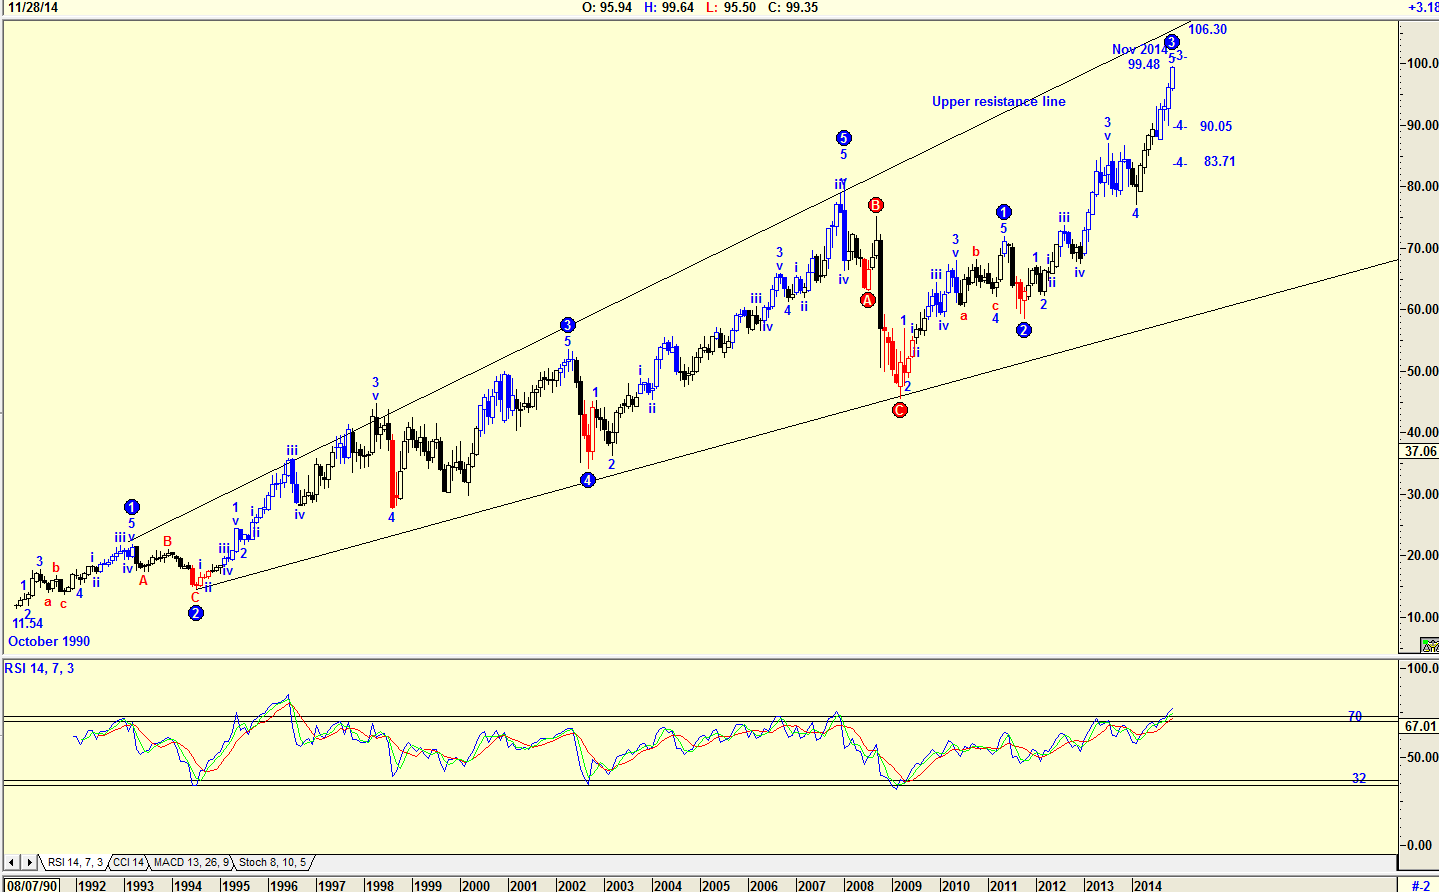
| Figure 1. Monthly Chart With Elliott Wave Count. Here you see how the share price of Pepsico (PEP) has risen from a low of $11.54 in October 1990 to a high of $99.48 by November 2014. |
| Graphic provided by: AdvancedGET. |
| |
| The chart in Figure 1 is a monthly chart that shows how the share price of PEP has risen from a low of $11.54 in October 1990 to a high of $99.48 by November 2014. The Elliott Wave count is suggesting that a WAVE 3 could be completed and that a Wave 4 correction to $90.05 or $83.71 could occur. The relative strength index (RSI) is overbought, above the 70 horizontal line. When the RSI falls below the 70 line or below the moving average (red) tracing the RSI, then a sell signal will be given. The possibility that the share price could rise further to test that upper resistance in the region of 106.30 is also a possibility. |

|
| |
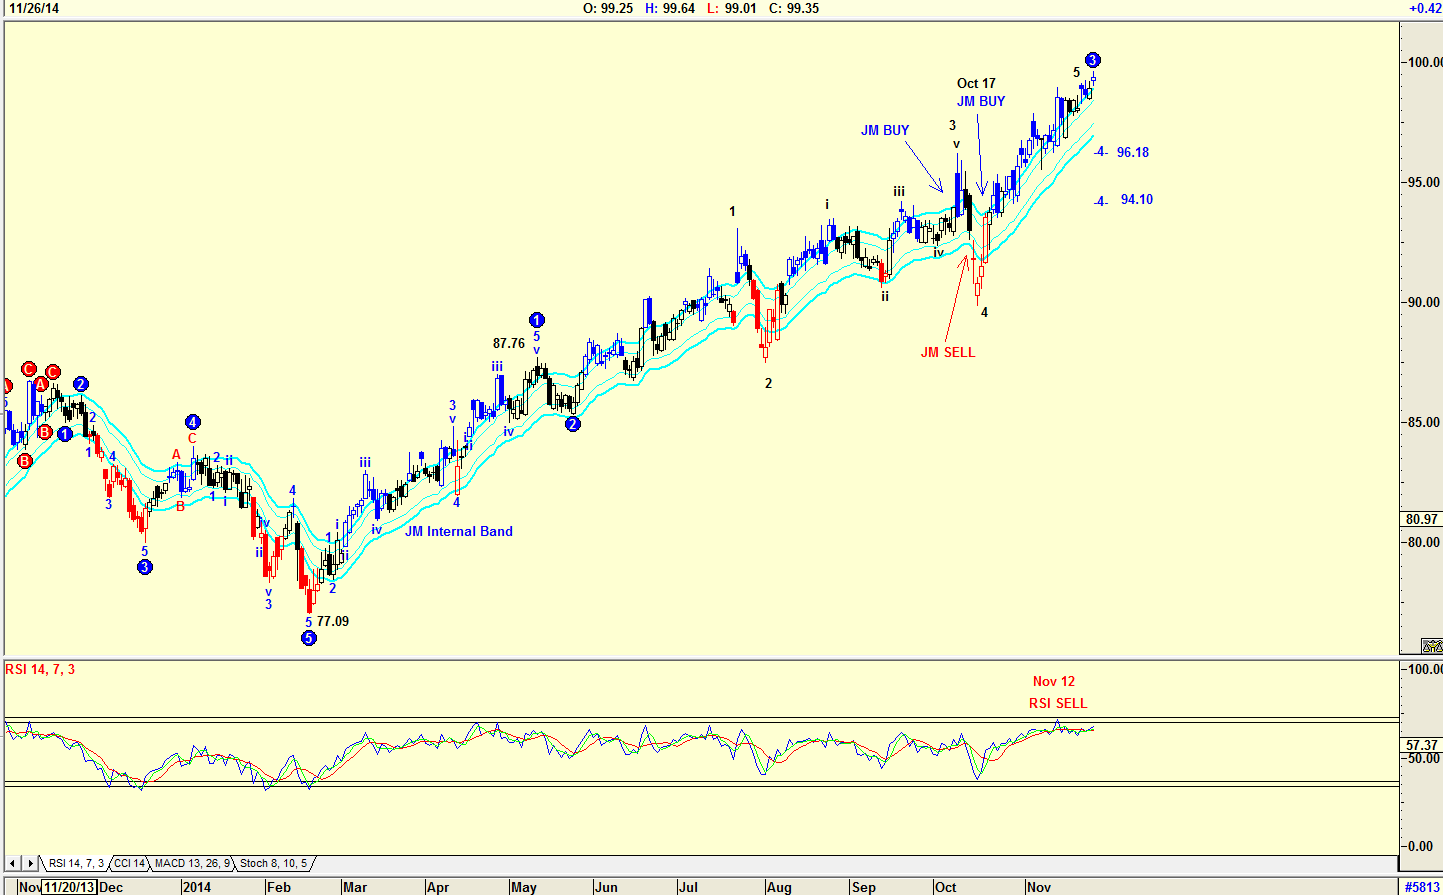
| The daily chart in Figure 2 has an Elliott Wave count suggesting that a Wave 3 is complete and that the share price will fall to either $96.18 or $94.10. The JM Internal Band indicator gave a buy signal on October 17, 2014. The JM Internal Band indicator is a 15-period simple moving average offset by 2% positive and 2% negative. A buy signal is given when the share price breaks above the upper band as shown on the chart, and a sell signal when the price breaks below the lower band. I would not be a buyer of PEP shares at the moment. The chart is suggesting that the share price is not a buy even though the share price is above the upper JM Internal band. The RSI is suggesting a sell. The share should, however, be placed on a watch list, for a confirming buy signal, with the target once a buy signal is given, being in the region of $106.86. This is calculated because a wave 5 is usually equal to a wave 1. The length of wave 1 was $10.68. (87.76-77.09=10.68 +96.18=106.86). |
Has been a technical analyst since 1969, and has worked as a futures and options trader with First Financial Futures in Johannesburg, South Africa.
| Address: | 3256 West 24th Ave |
| Vancouver, BC | |
| Phone # for sales: | 6042634214 |
| E-mail address: | petroosp@gmail.com |
Click here for more information about our publications!
PRINT THIS ARTICLE

Request Information From Our Sponsors
- StockCharts.com, Inc.
- Candle Patterns
- Candlestick Charting Explained
- Intermarket Technical Analysis
- John Murphy on Chart Analysis
- John Murphy's Chart Pattern Recognition
- John Murphy's Market Message
- MurphyExplainsMarketAnalysis-Intermarket Analysis
- MurphyExplainsMarketAnalysis-Visual Analysis
- StockCharts.com
- Technical Analysis of the Financial Markets
- The Visual Investor
- VectorVest, Inc.
- Executive Premier Workshop
- One-Day Options Course
- OptionsPro
- Retirement Income Workshop
- Sure-Fire Trading Systems (VectorVest, Inc.)
- Trading as a Business Workshop
- VectorVest 7 EOD
- VectorVest 7 RealTime/IntraDay
- VectorVest AutoTester
- VectorVest Educational Services
- VectorVest OnLine
- VectorVest Options Analyzer
- VectorVest ProGraphics v6.0
- VectorVest ProTrader 7
- VectorVest RealTime Derby Tool
- VectorVest Simulator
- VectorVest Variator
- VectorVest Watchdog
