

HOT TOPICS LIST
- MACD
- Fibonacci
- RSI
- Gann
- ADXR
- Stochastics
- Volume
- Triangles
- Futures
- Cycles
- Volatility
- ZIGZAG
- MESA
- Retracement
- Aroon
INDICATORS LIST
LIST OF TOPICS
PRINT THIS ARTICLE
by Donald W. Pendergast, Jr.
After hitting a five year high in early November 2014, shares of Goldman Sachs are reversing lower in the wake of a failure swing.
Position: N/A
Donald W. Pendergast, Jr.
Freelance financial markets writer and online publisher of the Trendzetterz.com S&P 500 Weekly Forecast service.
PRINT THIS ARTICLE
CYCLES
GS: Failure Swing Hints At Bigger Pullback
12/02/14 05:23:46 PMby Donald W. Pendergast, Jr.
After hitting a five year high in early November 2014, shares of Goldman Sachs are reversing lower in the wake of a failure swing.
Position: N/A
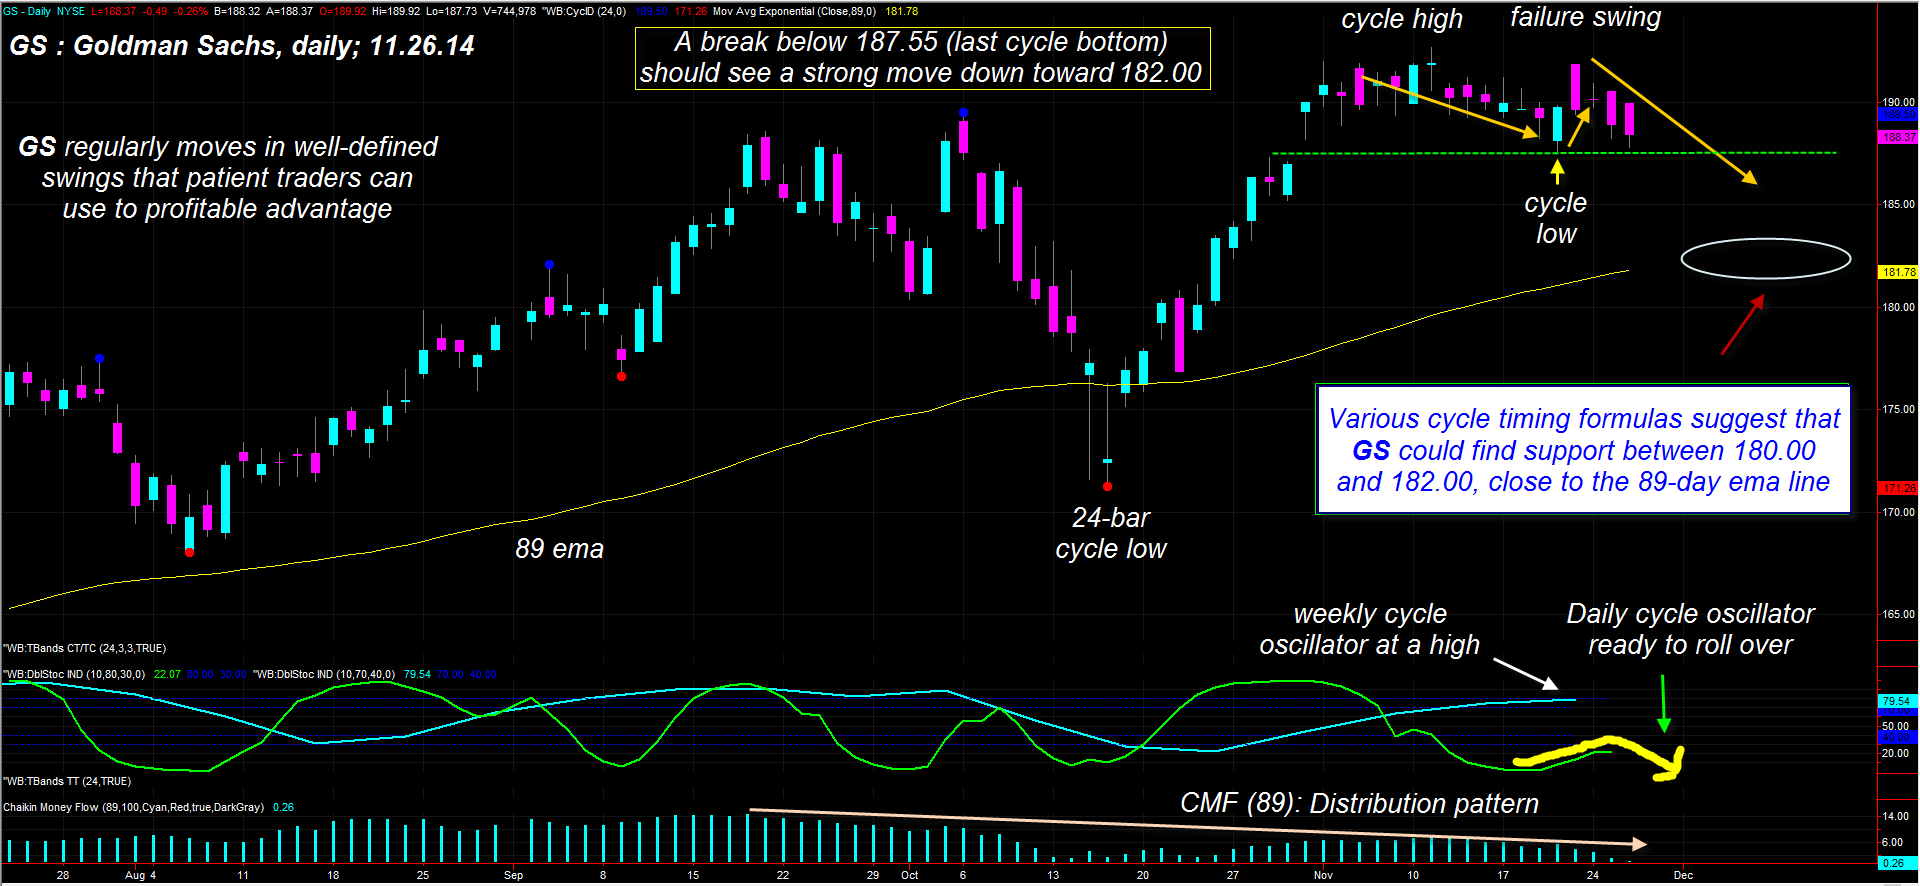
| Godman Sachs (GS) suffered only modest price declines in the September/October 2014 market debacle; the stock bottomed on October 15, 2014 with the rest of the broad market before going on to form a dramatic 'V' reversal pattern — the type seen only rarely. The stock rallied by 12.5% between October 15, 2014 and November 11, 2014, setting a five year high in the process. Cycles and money flow analysis now suggests that the recent failure swing of November 21, 2014 was the commencement of what might turn out to be a tradable bearish move down toward $180.00. Here's a closer look now. |
|
| Figure 1. Goldman Sachs (GS): The failure swing of November 21, 2014 has setup a potential bull-to-bear cyclical phase shift; the next mid-cycle low may not occur until the first or second week of December 2014, perhaps in the lower $180 price range. |
| Graphic provided by: TradeStation. |
| Graphic provided by: ProfitTrader7 from www.walterbressert.com. |
| |
| The wise and judicious use of price cycle analysis can help keep traders one step ahead of the markets they follow; knowing where high probability time/price turning points are likely to appear — sometimes well in advance — can help a trader filter out the iffy and marginal trade setups as he/she waits for the most opportune ones to finally develop. In the case of GS, its dominant daily chart cycle comes in at approximately 24 bars (trough to trough basis), with the mid-October 2014 low of 171.28 being the start of a fresh bullish cycle (Figure 1). The cycle peaked 18 bars later at 192.68 (November 11, 2014) and then bottomed on bar 25 on November 20, 2014 at 187.55. The sudden lurch higher on November 21, 2014 certainly confirmed that particular cycle count but failed quickly — lasting only one day — as it gapped higher at the open and sold off hard all session long. This was important in the cyclical scheme of things, as it demonstrated: 1.That there was no demand for GS above 191.83 proved that a much larger cycle in the range of 100-120 bars had also topped at the same time as the 24-bar cycle — as depicted by the light blue cycle oscillator at the bottom of the chart. 2. The bullish 24-bar cycle may have been shifting to a bearish phase (lower swing highs, lower swing lows); note how the green cycle oscillator looks as if it's ready to rollover (yellow arrow) and how bearish it has been since the November 11, 2014 cycle high was made. Several other financial sector stocks such as JPM and MS are also manifesting similar cyclical patterns, so this is definitely something to be aware of after such a stupendous rally. The long-term Chaikin Money Flow histogram (CMF)(89) also reveals that the "smart money" used the last rally to distribute their shares to latecomers; the lower histogram highs make this case very well. Right now, the latest 24-day cycle is only on bar 4 and all signs suggest that GS is now moving into a bearish cycle phase, one that will be confirmed when the cycle low at 187.55 is taken out and also when the lower edge of the open gap at 187.31 is finally closed. If one or both of these events happens within the next few trading sessions, the stage will be set for GS (and JPM, MS and several other financial sector giants) to decline into at least early December 2014. In fact, the cycle timing forecast reveals that GS is not likely to find its next mid-cycle low until at least December 4, 2014 (and possibly as late as December 15, 2014) and that the full 24-bar cycle may not finally bottom until December 26, 2014. |
|
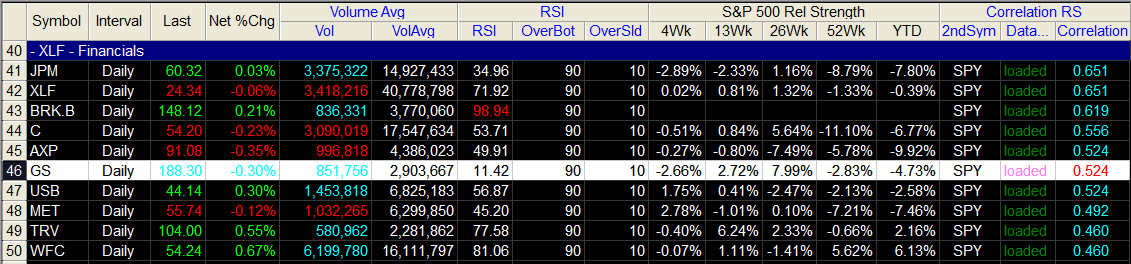
| Figure 2. Relative Performance. Trading was very light on Wednesday November 26, 2014; many large cap S&P 500 index (.SPX, SPY) issues are near potential cycle phase shifts, as is GS. |
| Graphic provided by: TradeStation. |
| Graphic provided by: TradeStation 9.1 RadarScreen. |
| |
| Strong support for GS currently resides in the 180.00 to 182.00 area (near the yellow 89-day exponential moving average or EMA) and that could be where the mid-cycle low (approximately 12 bars) will bottom out. For those planning to short GS on a break beneath 187.55, the yellow EMA line would be a great place to take profits (some if not all), even if you are super bearish on the markets; shorting a stock always entails the risk of short covering rallies, and a short move down into a strong support zone is always a place you want to be careful to have minimal bearish exposure in. Account risk should be kept at 2% or less for this setup, regardless of whether you choose to buy puts or simply short the shares directly. Trade wisely until we meet here again. |
Freelance financial markets writer and online publisher of the Trendzetterz.com S&P 500 Weekly Forecast service.
| Title: | Market consultant and writer |
| Company: | Trendzetterz |
| Address: | 81 Hickory Hollow Drive |
| Crossville, TN 38555 | |
| Phone # for sales: | 904-303-4814 |
| Website: | trendzetterz.com |
| E-mail address: | support@trendzetterz.com |
Traders' Resource Links | |
| Trendzetterz has not added any product or service information to TRADERS' RESOURCE. | |
Click here for more information about our publications!
PRINT THIS ARTICLE

Request Information From Our Sponsors
- VectorVest, Inc.
- Executive Premier Workshop
- One-Day Options Course
- OptionsPro
- Retirement Income Workshop
- Sure-Fire Trading Systems (VectorVest, Inc.)
- Trading as a Business Workshop
- VectorVest 7 EOD
- VectorVest 7 RealTime/IntraDay
- VectorVest AutoTester
- VectorVest Educational Services
- VectorVest OnLine
- VectorVest Options Analyzer
- VectorVest ProGraphics v6.0
- VectorVest ProTrader 7
- VectorVest RealTime Derby Tool
- VectorVest Simulator
- VectorVest Variator
- VectorVest Watchdog
- StockCharts.com, Inc.
- Candle Patterns
- Candlestick Charting Explained
- Intermarket Technical Analysis
- John Murphy on Chart Analysis
- John Murphy's Chart Pattern Recognition
- John Murphy's Market Message
- MurphyExplainsMarketAnalysis-Intermarket Analysis
- MurphyExplainsMarketAnalysis-Visual Analysis
- StockCharts.com
- Technical Analysis of the Financial Markets
- The Visual Investor