

HOT TOPICS LIST
- MACD
- Fibonacci
- RSI
- Gann
- ADXR
- Stochastics
- Volume
- Triangles
- Futures
- Cycles
- Volatility
- ZIGZAG
- MESA
- Retracement
- Aroon
INDICATORS LIST
LIST OF TOPICS
PRINT THIS ARTICLE
by Matt Blackman
It isn't often that a $6 stock exhibits a combination of a bullish chart pattern and strong fundamentals. Here's one that has both.
Position: N/A
Matt Blackman
Matt Blackman is a full-time technical and financial writer and trader. He produces corporate and financial newsletters, and assists clients in getting published in the mainstream media. He is the host of TradeSystemGuru.com. Matt has earned the Chartered Market Technician (CMT) designation. Find out what stocks and futures Matt is watching on Twitter at www.twitter.com/RatioTrade
PRINT THIS ARTICLE
CUP WITH HANDLE
What's Up With EVC?
12/03/14 03:14:38 PMby Matt Blackman
It isn't often that a $6 stock exhibits a combination of a bullish chart pattern and strong fundamentals. Here's one that has both.
Position: N/A
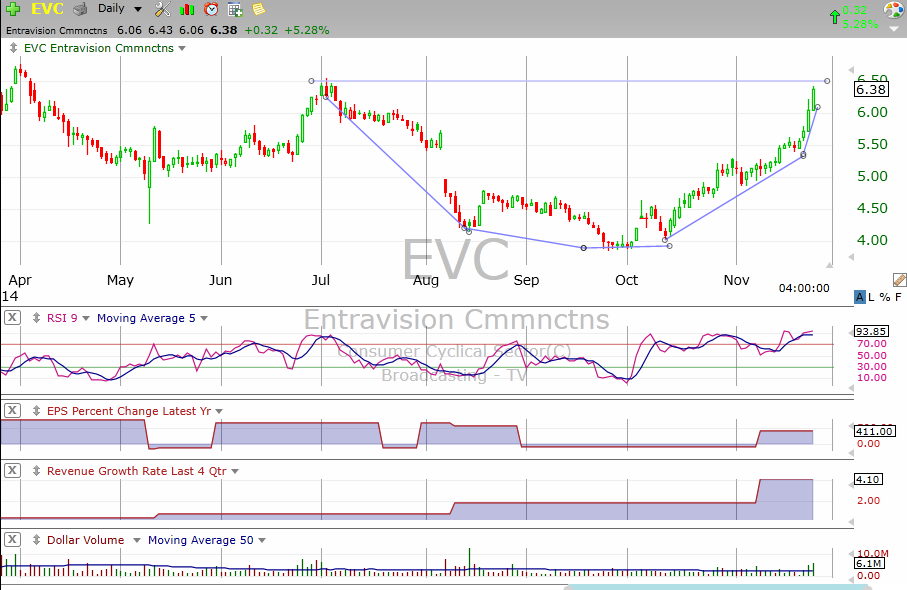
| While performing a regular search for stocks I call "high fliers" (stocks that rank in the top 5% in their 30-day and five-day price trends versus the rest of the market, have posted gains on a daily and weekly basis and daily share dollar volumes greater than $100k), EVC came in at the top of the class of 10 stocks on November 25, 2014. A quick glance at the daily chart in Figure 1 revealed an interesting cup & handle pattern in the process of forming on the chart. But this characteristic wasn't the only standout. |
|
| Figure 1. Daily Chart Of EVC Communications (EVC). Here you see the cup & handle pattern with overhead resistance around %6.50, annual earnings per share growth of its most recent quarterly filing of +411% and steady revenue growth to boot. |
| Graphic provided by: TC2000.com. |
| |
| A glance at the fundamentals revealed another pleasant surprise. Although the stock was only trading in the $6 range, it boasted a price/earnings ratio of just 3.25 which is almost unheard of in this price range. What that said to me is that this stock looks to be an earnings powerhouse. |
| A closer look at the fundamentals confirmed this take. In its most recent earnings release on November 6, 2015 the stock had enjoyed Q3 net revenue and consolidated EBITA (earnings before interest, tax, and amortization) growth of +8% and +5% respectively. Free cash flow had also increased 26% and the company was in the process of repurchasing its own stock! Certainly the company was not hurting for cash. |
|
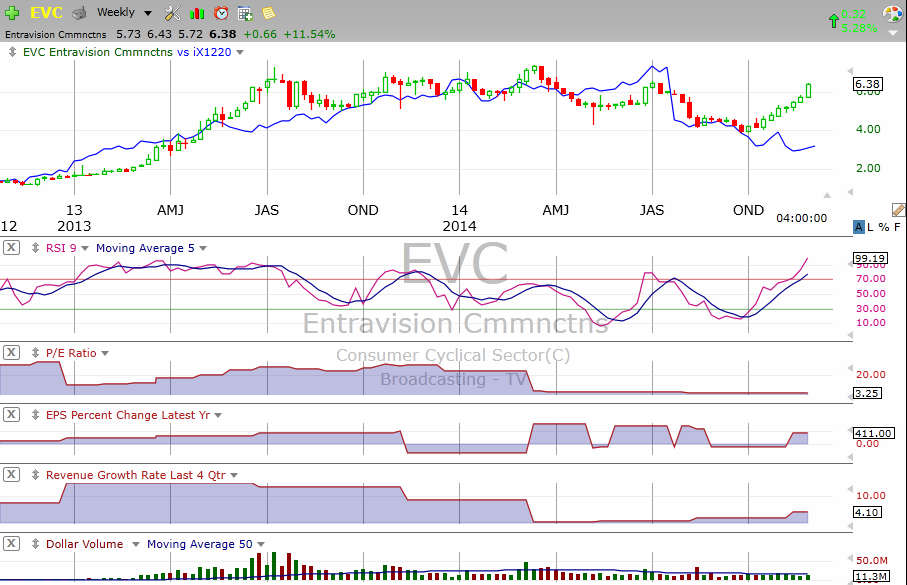
| Figure 2. Weekly Chart. Here you see more data for EVC together with the Broadcasting TV industry (blue line). No wonder it is outperforming its industry. Note the P/E which was north of 30 times in December 2012 and is now just 3.25. |
| Graphic provided by: TC2000.com. |
| |
| The next test for EVC will come at key resistance around $6.50. If the stock takes a breather there and consolidates on declining volume, it will indicate that a bullish 'handle' is building. A break above handle resistance can often be a powerful buy signal. |
| This is one I'll be watching closely over the next few weeks, especially if the tech rally continues. |
Matt Blackman is a full-time technical and financial writer and trader. He produces corporate and financial newsletters, and assists clients in getting published in the mainstream media. He is the host of TradeSystemGuru.com. Matt has earned the Chartered Market Technician (CMT) designation. Find out what stocks and futures Matt is watching on Twitter at www.twitter.com/RatioTrade
| Company: | TradeSystemGuru.com |
| Address: | Box 2589 |
| Garibaldi Highlands, BC Canada | |
| Phone # for sales: | 604-898-9069 |
| Fax: | 604-898-9069 |
| Website: | www.tradesystemguru.com |
| E-mail address: | indextradermb@gmail.com |
Traders' Resource Links | |
| TradeSystemGuru.com has not added any product or service information to TRADERS' RESOURCE. | |
Click here for more information about our publications!
Comments

Request Information From Our Sponsors
- StockCharts.com, Inc.
- Candle Patterns
- Candlestick Charting Explained
- Intermarket Technical Analysis
- John Murphy on Chart Analysis
- John Murphy's Chart Pattern Recognition
- John Murphy's Market Message
- MurphyExplainsMarketAnalysis-Intermarket Analysis
- MurphyExplainsMarketAnalysis-Visual Analysis
- StockCharts.com
- Technical Analysis of the Financial Markets
- The Visual Investor
- VectorVest, Inc.
- Executive Premier Workshop
- One-Day Options Course
- OptionsPro
- Retirement Income Workshop
- Sure-Fire Trading Systems (VectorVest, Inc.)
- Trading as a Business Workshop
- VectorVest 7 EOD
- VectorVest 7 RealTime/IntraDay
- VectorVest AutoTester
- VectorVest Educational Services
- VectorVest OnLine
- VectorVest Options Analyzer
- VectorVest ProGraphics v6.0
- VectorVest ProTrader 7
- VectorVest RealTime Derby Tool
- VectorVest Simulator
- VectorVest Variator
- VectorVest Watchdog