

HOT TOPICS LIST
- MACD
- Fibonacci
- RSI
- Gann
- ADXR
- Stochastics
- Volume
- Triangles
- Futures
- Cycles
- Volatility
- ZIGZAG
- MESA
- Retracement
- Aroon
INDICATORS LIST
LIST OF TOPICS
PRINT THIS ARTICLE
by Matt Blackman
It's been rough seas from some residential REITs and Two Harbors is no exception. And although the stock price has been rising since early October 2014, a chart pattern that has been building indicates possible trouble ahead.
Position: N/A
Matt Blackman
Matt Blackman is a full-time technical and financial writer and trader. He produces corporate and financial newsletters, and assists clients in getting published in the mainstream media. He is the host of TradeSystemGuru.com. Matt has earned the Chartered Market Technician (CMT) designation. Find out what stocks and futures Matt is watching on Twitter at www.twitter.com/RatioTrade
PRINT THIS ARTICLE
WEDGE FORMATIONS
Is Two Harbors Investment Corp Headed For The Rocks?
12/01/14 06:11:13 PMby Matt Blackman
It's been rough seas from some residential REITs and Two Harbors is no exception. And although the stock price has been rising since early October 2014, a chart pattern that has been building indicates possible trouble ahead.
Position: N/A
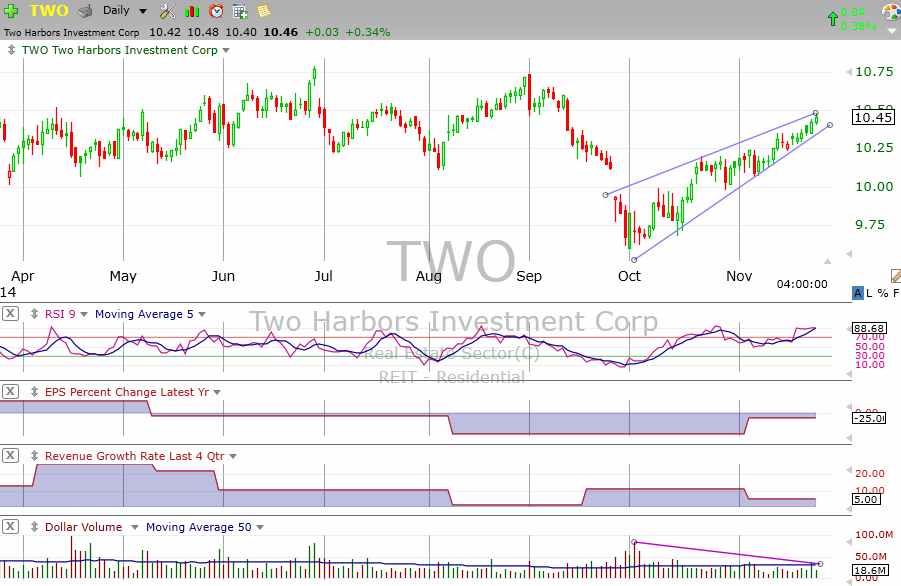
| Between first going public in October 2009 and late March 2013, Two Harbors Investment Corp. (TWO) earned investors a respectable +40% gain. Traders who accurately timed the stock did significantly better. But then something happened which caused the stock to lose more than 30% of its value by December 2013. Although earnings per share logged an impressive gain from -6.2% to more than +90% on an annual basis, revenues continued to fall, revealing a disturbing margin squeeze due in a large part to tightening interest rate spreads. |
|
| Figure 1: Facing Uncertainty. Two Harbors Investment Corp is a residential mortgage REIT that faces an uncertain future. Earnings per share have been negative since May and quarterly revenues have suffered an almost linear decline. Note the bearish rising wedge chart pattern on the right combined with the classic pattern confirmation indicator — falling volume over the duration of the pattern. |
| Graphic provided by: TC2000.com. |
| |
| Since May, when earnings per share growth turned negative, the stock price has struggled dropping more than 10% in the month of September alone. And even though the fundamental picture didn't improve much, the stock began to rally in October. But is this rally sustainable? |
|
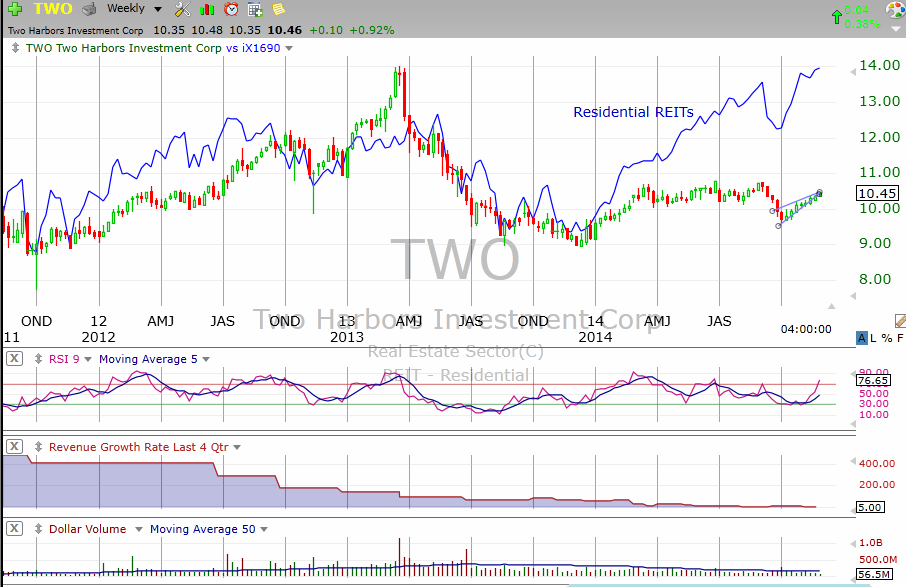
| Figure 2. Weekly Chart Of TWO And Its Industry (blue). Here you see the stock performance over the last three years together with a troubling combination of falling revenues and the recent bearish rising wedge. |
| Graphic provided by: TC2000.com. |
| |
| Besides the deteriorating fundamentals, there are two other causes for concern. First, TWO has been underperforming the residential REIT industry since October, an indication that it faces more challenges than its peers. Secondly, as we see in Figure 1, TWO is in the process of posting a bearish-looking rising wedge pattern together with declining volume over the pattern. Finally, from a shorter term perspective, the stock is also overbought according to its nine period relative strength index (RSI). |
| If lower rising wedge support is broken and the stock drops below $10.35 on rising selling volume, TWO could suffer a sizeable drop especially if the overall stock market weakens or we see interest rates rise in the near future. At the very least, it may be a good time to take some profits if you haven't done so already! |
Matt Blackman is a full-time technical and financial writer and trader. He produces corporate and financial newsletters, and assists clients in getting published in the mainstream media. He is the host of TradeSystemGuru.com. Matt has earned the Chartered Market Technician (CMT) designation. Find out what stocks and futures Matt is watching on Twitter at www.twitter.com/RatioTrade
| Company: | TradeSystemGuru.com |
| Address: | Box 2589 |
| Garibaldi Highlands, BC Canada | |
| Phone # for sales: | 604-898-9069 |
| Fax: | 604-898-9069 |
| Website: | www.tradesystemguru.com |
| E-mail address: | indextradermb@gmail.com |
Traders' Resource Links | |
| TradeSystemGuru.com has not added any product or service information to TRADERS' RESOURCE. | |
Click here for more information about our publications!
Comments

Request Information From Our Sponsors
- StockCharts.com, Inc.
- Candle Patterns
- Candlestick Charting Explained
- Intermarket Technical Analysis
- John Murphy on Chart Analysis
- John Murphy's Chart Pattern Recognition
- John Murphy's Market Message
- MurphyExplainsMarketAnalysis-Intermarket Analysis
- MurphyExplainsMarketAnalysis-Visual Analysis
- StockCharts.com
- Technical Analysis of the Financial Markets
- The Visual Investor
- VectorVest, Inc.
- Executive Premier Workshop
- One-Day Options Course
- OptionsPro
- Retirement Income Workshop
- Sure-Fire Trading Systems (VectorVest, Inc.)
- Trading as a Business Workshop
- VectorVest 7 EOD
- VectorVest 7 RealTime/IntraDay
- VectorVest AutoTester
- VectorVest Educational Services
- VectorVest OnLine
- VectorVest Options Analyzer
- VectorVest ProGraphics v6.0
- VectorVest ProTrader 7
- VectorVest RealTime Derby Tool
- VectorVest Simulator
- VectorVest Variator
- VectorVest Watchdog