

HOT TOPICS LIST
- MACD
- Fibonacci
- RSI
- Gann
- ADXR
- Stochastics
- Volume
- Triangles
- Futures
- Cycles
- Volatility
- ZIGZAG
- MESA
- Retracement
- Aroon
INDICATORS LIST
LIST OF TOPICS
PRINT THIS ARTICLE
by Donald W. Pendergast, Jr.
After making a measured correction into a key cycle bottom, shares of Workday, Inc. may be ready for a sprint toward $100 per share.
Position: N/A
Donald W. Pendergast, Jr.
Freelance financial markets writer and online publisher of the Trendzetterz.com S&P 500 Weekly Forecast service.
PRINT THIS ARTICLE
CYCLES
Workday, Inc.: Proportional Pullback To Cycle Bottom
11/26/14 04:55:22 PMby Donald W. Pendergast, Jr.
After making a measured correction into a key cycle bottom, shares of Workday, Inc. may be ready for a sprint toward $100 per share.
Position: N/A
| Most large-, mid-, and small-cap stocks rallied sharply after October's incredible 'V' reversal; among computer enterprise software industry group stocks, shares of Workday, Inc. (WDAY) were top performers, up by more than 29% in the first two weeks of the rally. The stock has been in a gradual (-7.5%) correction over the past three and a half weeks and may now be ready to surge once again, with a powerful continuation move setting up. Here's a closer look now. |
|
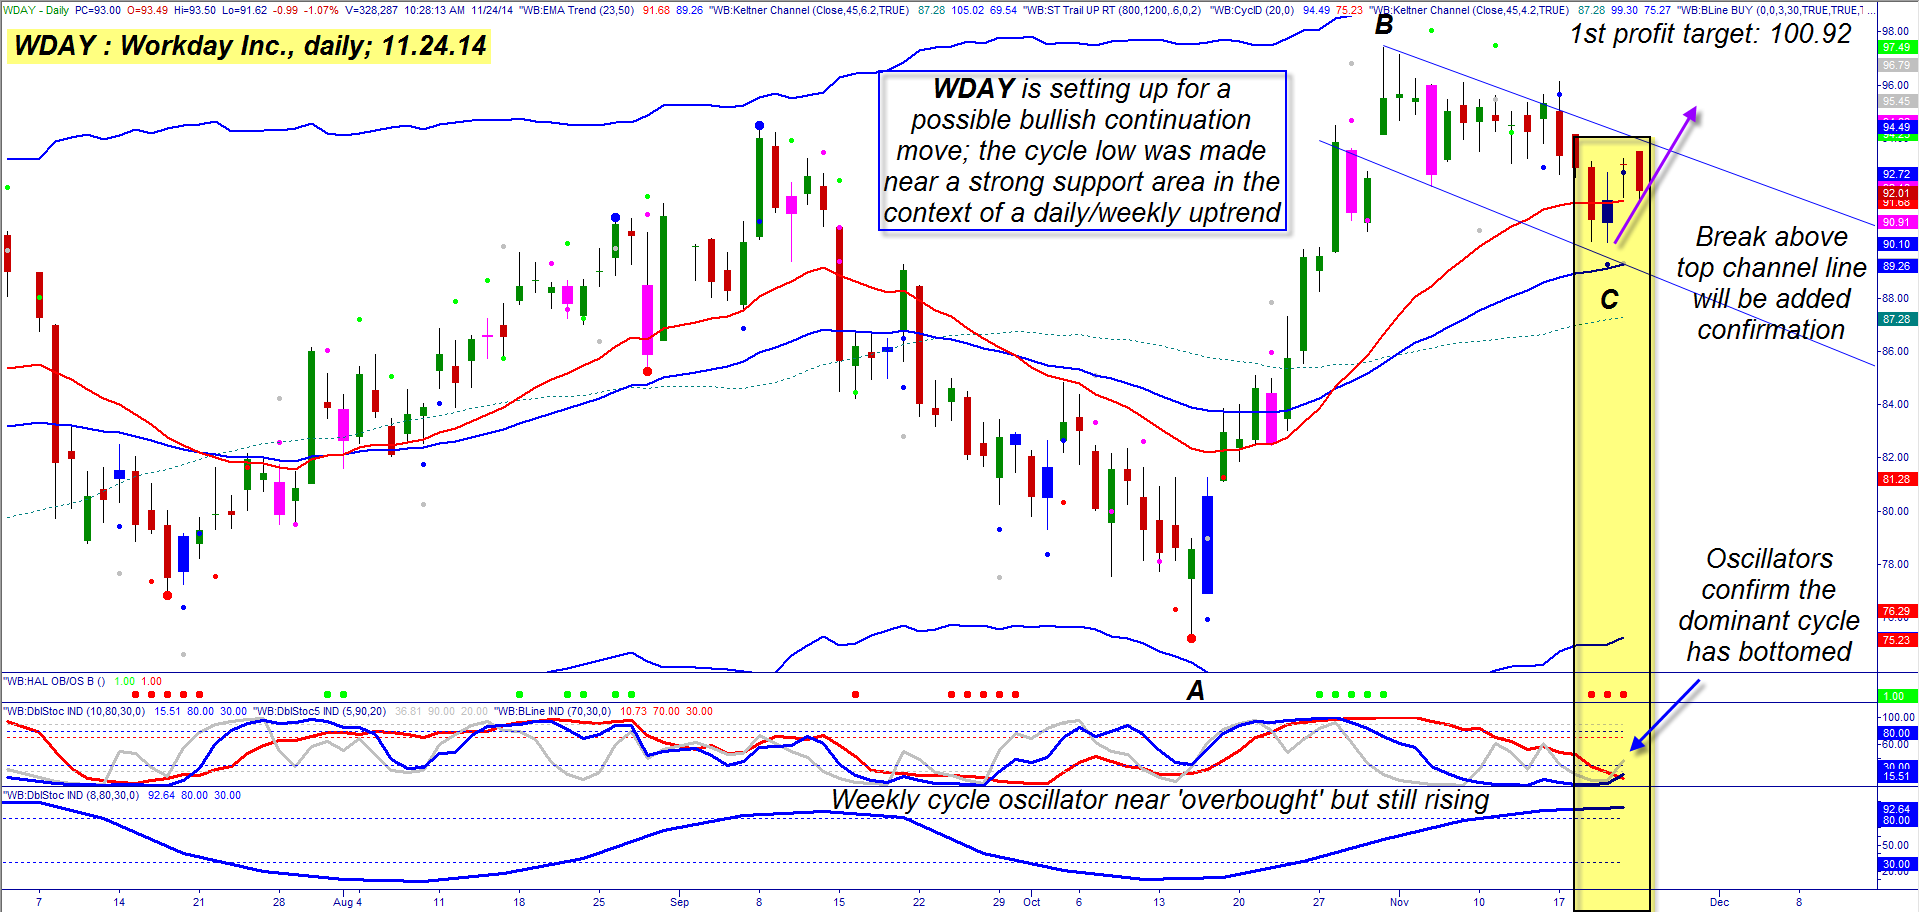
| Figure 1. Workday Inc. (WDAY). It may now be on the verge of a bullish continuation move, with a minimum price target of approximately 100.92. |
| Graphic provided by: TradeStation. |
| Graphic provided by: ProfitTrader7 from www.walterbressert.com. |
| |
| WDAY's daily chart (Figure 1) offers a fascinating look at the mechanics of a correction in the midst of an ongoing bullish trend; since WDAY regularly makes nice (tradable) multiday (multiweek) price swings, this current correction into a major support area certainly warrants further investigation: 1. The rally from 75.23 (October 15, 2014) up to 97.40 (October 31, 2014) was good for a 29.4% increase and had powerful momentum. Note that the subsequent correction was less than 38% of the initial thrust higher and was only 7.5% in absolute price terms, forming a bullish consolidation (flag) pattern — the type that frequently precede bullish continuation moves. 2. The red/blue exponential moving averages (EMA) have thus far acted as support on the decline, still maintaining a relatively wide spread. 3. The three cycles-based oscillators all suggest that a significant cycle low has been achieved as of Thursday November 20, 2014. 4. The three horizontal red dots also confirm a meaningful oversold price level has been reached on the decline to 90.10 5. The blue weekly cycle oscillator at the bottom of the chart, although technically overbought, is still rising and as such confirms that the major trend is still up 6. The 21-, 34-, 55- and 89-day Chaikin Money Flow histograms (not shown) are all above their respective zero lines; the 89-day is especially strong, indicating that institutional traders may still have an interest in pushing WDAY higher into December 2014. The Fibonacci swing price targets for this current setup are as follows: 100.92 (.618 * swing AB) 107.62 (1.00 * swing AB) 112.39 (1.272 * swing AB) Any/all or none of these targets may be reached, of course, but if the bullish daily/weekly/monthly cycles continue in force (see Figure 2), this new daily reversal could be the launching pad toward higher valuations in WDAY as 2014 draws to a close. |
|
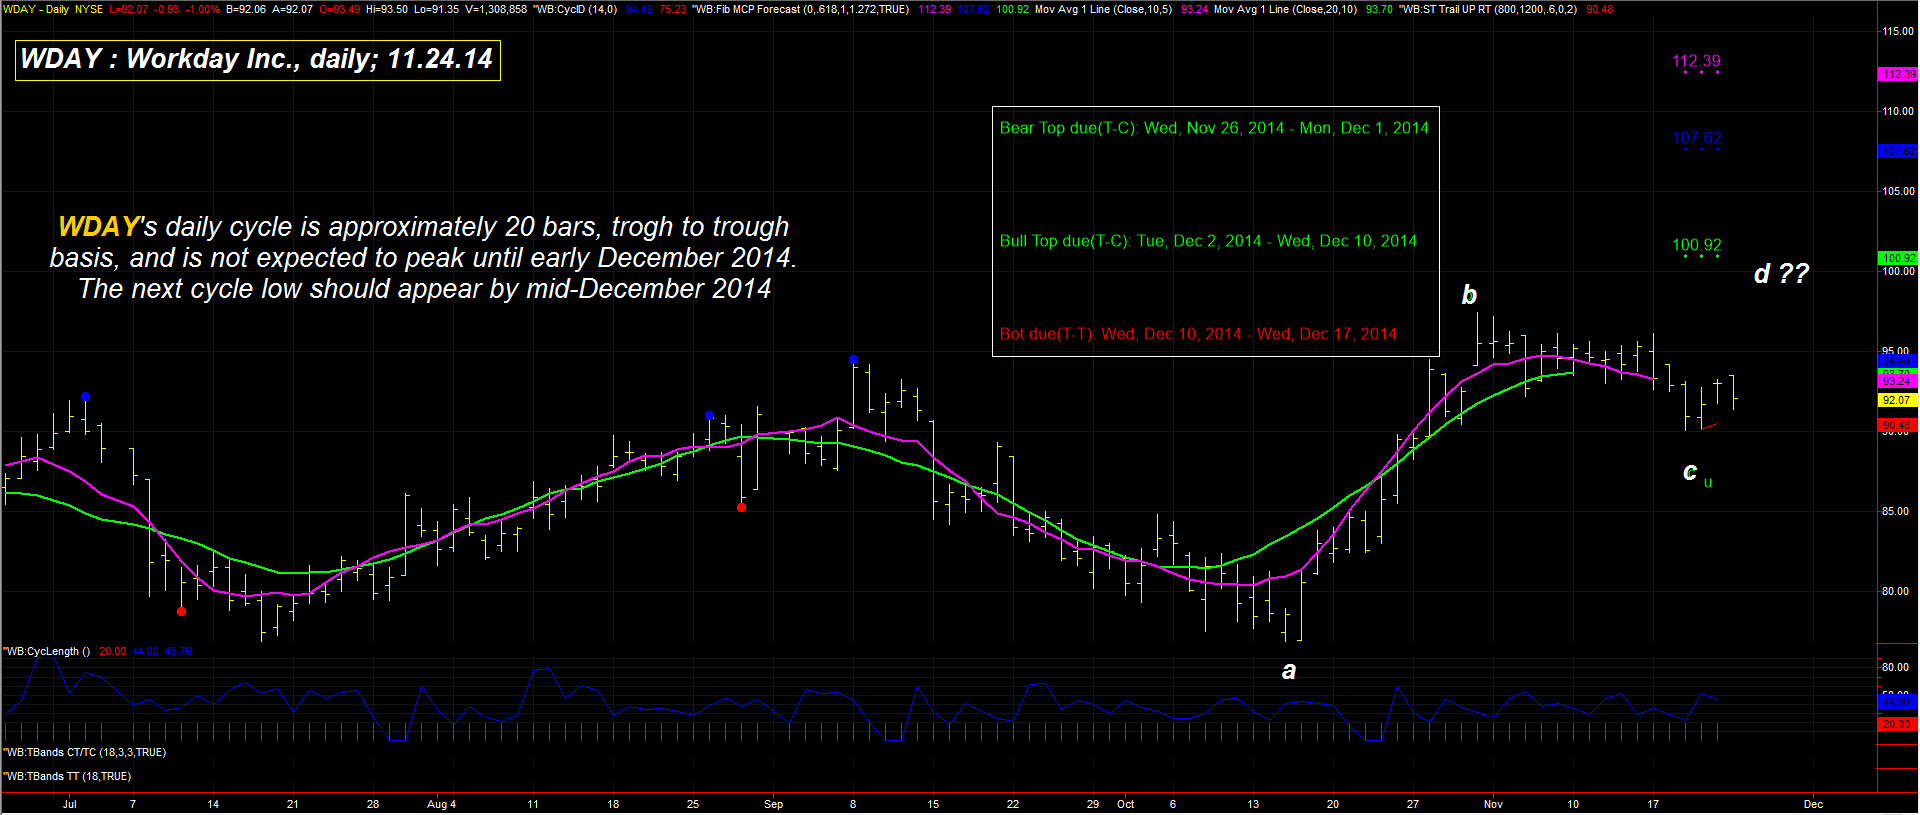
| Figure 2. Price Cycles. WDAY has a 20-day price cycle on its daily time frame, given the bullish trend dynamics at work here, the current cycle high isn't due until sometime between December 2, 2014 and December 10, 2014. |
| Graphic provided by: TradeStation. |
| Graphic provided by: ProfitTrader7 from www.walterbressert.com. |
| |
| As a continuation trade setup, account risk for this one can be upped to about 2% (as opposed to .5%-1% for a trend reversal setup, which is inherently more risky) and a two- to three-bar trailing stop of the daily lows can be used to manage the position. If prices begin to edge close to the 100.00 area, look to take at least partial profits or to run an even closer trailing stop. The weekly cyclical action in the S&P 500 index (.SPX, SPY) is still pointing toward a bit more upside before a correction, so this long WDAY trade will certainly have the power of the broader market pushing it higher, all else being equal. Trade wisely until we meet here again. |
Freelance financial markets writer and online publisher of the Trendzetterz.com S&P 500 Weekly Forecast service.
| Title: | Market consultant and writer |
| Company: | Trendzetterz |
| Address: | 81 Hickory Hollow Drive |
| Crossville, TN 38555 | |
| Phone # for sales: | 904-303-4814 |
| Website: | trendzetterz.com |
| E-mail address: | support@trendzetterz.com |
Traders' Resource Links | |
| Trendzetterz has not added any product or service information to TRADERS' RESOURCE. | |
Click here for more information about our publications!
PRINT THIS ARTICLE

Request Information From Our Sponsors
- VectorVest, Inc.
- Executive Premier Workshop
- One-Day Options Course
- OptionsPro
- Retirement Income Workshop
- Sure-Fire Trading Systems (VectorVest, Inc.)
- Trading as a Business Workshop
- VectorVest 7 EOD
- VectorVest 7 RealTime/IntraDay
- VectorVest AutoTester
- VectorVest Educational Services
- VectorVest OnLine
- VectorVest Options Analyzer
- VectorVest ProGraphics v6.0
- VectorVest ProTrader 7
- VectorVest RealTime Derby Tool
- VectorVest Simulator
- VectorVest Variator
- VectorVest Watchdog
- StockCharts.com, Inc.
- Candle Patterns
- Candlestick Charting Explained
- Intermarket Technical Analysis
- John Murphy on Chart Analysis
- John Murphy's Chart Pattern Recognition
- John Murphy's Market Message
- MurphyExplainsMarketAnalysis-Intermarket Analysis
- MurphyExplainsMarketAnalysis-Visual Analysis
- StockCharts.com
- Technical Analysis of the Financial Markets
- The Visual Investor