HOT TOPICS LIST
- MACD
- Fibonacci
- RSI
- Gann
- ADXR
- Stochastics
- Volume
- Triangles
- Futures
- Cycles
- Volatility
- ZIGZAG
- MESA
- Retracement
- Aroon
INDICATORS LIST
LIST OF TOPICS
PRINT THIS ARTICLE
by Gary Grosschadl
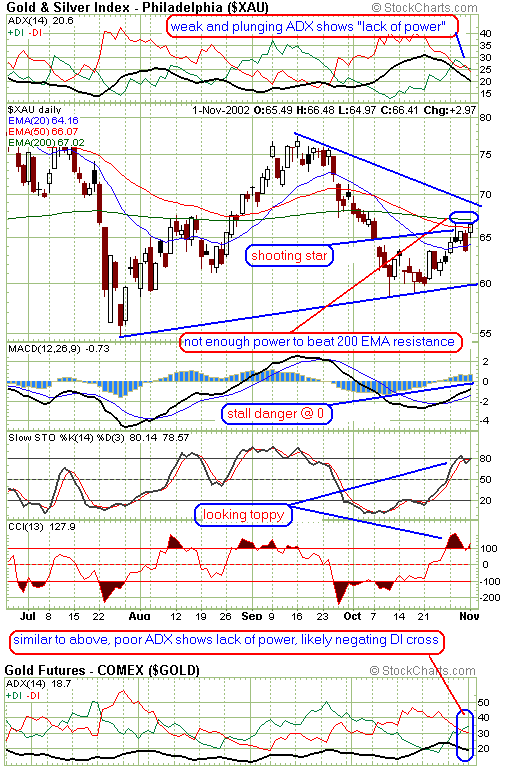
My favorite trend strength indicator, DMI (directional movement indicator), says gold price and the gold index do not have enough power in the short-term so expect a move down.
Position: N/A
Gary Grosschadl
Independent Canadian equities trader and technical analyst based in Peterborough
Ontario, Canada.
PRINT THIS ARTICLE
CHART ANALYSIS
DMI Says Lack of Power to Stall Golds
11/04/02 10:35:00 AMby Gary Grosschadl
My favorite trend strength indicator, DMI (directional movement indicator), says gold price and the gold index do not have enough power in the short-term so expect a move down.
Position: N/A
| In the past week many gold players have been expecting the Dow and other main indices to falter during this consolidation, thereby bidding gold stocks upwards. Well, the main indices showed great resilience and finished the week strong, hinting at more robust action early next week with gold probably heading the opposite way. |
| Analyzing the DMI (or more commonly called ADX), shows this "lack of power," not only for the gold index but also the gold price. When markets are trending strongly, the best setup has +DI above -DI with the black ADX line upsloping (ideally above 20). This shows good power. A bullish setup, although not as predictable, can also occur when the DIs are bullish (+DI above -DI) and ADX is below both but UPSLOPING. In other words, as long as the ADX, as shown on both displays are headed down, there is negative or trendless action ahead in the short-term. |

|
| Graphic provided by: stockcharts.com. |
| |
| The shooting star candlestick on this chart several days ago hinted at a balk at major resistance, namely the 200-day EMA. A move beyond negates this shooting star, but as I see it there is just not enough power right now to beat this shooting star and overhead moving average resistance. |
| Based on the above analysis, a move towards the lower blue trendline (60) is much more likely than a move to challenge the opposite and higher trendline at 68. |
| Looking further down the road when the main indices reverse once again in a bout of profit taking, watch for a likely reversal for gold again with a much more positive ADX leading the way. Similarily ADX watchers should be on the outlook for signs of a bearish DI cross for the Dow/Nasdaq, indicating once again a change in directional strength. Until the bear is soundly beaten, the markets remain reversal oriented and traders need to be nimble or patiently waiting on the sidelines with cash. |
Independent Canadian equities trader and technical analyst based in Peterborough
Ontario, Canada.
| Website: | www.whatsonsale.ca/financial.html |
| E-mail address: | gwg7@sympatico.ca |
Click here for more information about our publications!
Comments
Date: 11/05/02Rank: 5Comment:
Date: 11/06/02Rank: 5Comment: I have been following this one. Excellent article. I have a question on the ADX,CCI settings. Would you recommend 5 or 14 for ADX,CCI ^ RSI? Thanks. Cheers,Padhu
padhus@hotmail.com

Request Information From Our Sponsors
- VectorVest, Inc.
- Executive Premier Workshop
- One-Day Options Course
- OptionsPro
- Retirement Income Workshop
- Sure-Fire Trading Systems (VectorVest, Inc.)
- Trading as a Business Workshop
- VectorVest 7 EOD
- VectorVest 7 RealTime/IntraDay
- VectorVest AutoTester
- VectorVest Educational Services
- VectorVest OnLine
- VectorVest Options Analyzer
- VectorVest ProGraphics v6.0
- VectorVest ProTrader 7
- VectorVest RealTime Derby Tool
- VectorVest Simulator
- VectorVest Variator
- VectorVest Watchdog
- StockCharts.com, Inc.
- Candle Patterns
- Candlestick Charting Explained
- Intermarket Technical Analysis
- John Murphy on Chart Analysis
- John Murphy's Chart Pattern Recognition
- John Murphy's Market Message
- MurphyExplainsMarketAnalysis-Intermarket Analysis
- MurphyExplainsMarketAnalysis-Visual Analysis
- StockCharts.com
- Technical Analysis of the Financial Markets
- The Visual Investor
