

HOT TOPICS LIST
- MACD
- Fibonacci
- RSI
- Gann
- ADXR
- Stochastics
- Volume
- Triangles
- Futures
- Cycles
- Volatility
- ZIGZAG
- MESA
- Retracement
- Aroon
INDICATORS LIST
LIST OF TOPICS
PRINT THIS ARTICLE
by Koos van der Merwe
When you receive a tip, either from a friend or a stock market expert, should you go ahead and buy the stock without doing your own research?
Position: Buy
Koos van der Merwe
Has been a technical analyst since 1969, and has worked as a futures and options trader with First Financial Futures in Johannesburg, South Africa.
PRINT THIS ARTICLE
ELLIOTT WAVE
Is Intel A Buy?
11/26/14 04:51:01 PMby Koos van der Merwe
When you receive a tip, either from a friend or a stock market expert, should you go ahead and buy the stock without doing your own research?
Position: Buy
| Of course the answer is going to be "no". It is always advisable to spend some time and research the movement of the stock either technically or fundamentally. You should never forget that "with every tip there is a tap." However, when the "tip" comes from a reliable source on a TV financial program, is that research still necessary? The question you should then ask yourself is, "Are you a long-term investor, or a short-term trader?" Whatever your answer, research is always necessary. Never forget about that reliable and honest "tap." So, with Intel (INTC) being tipped as a buy, is it? |
|
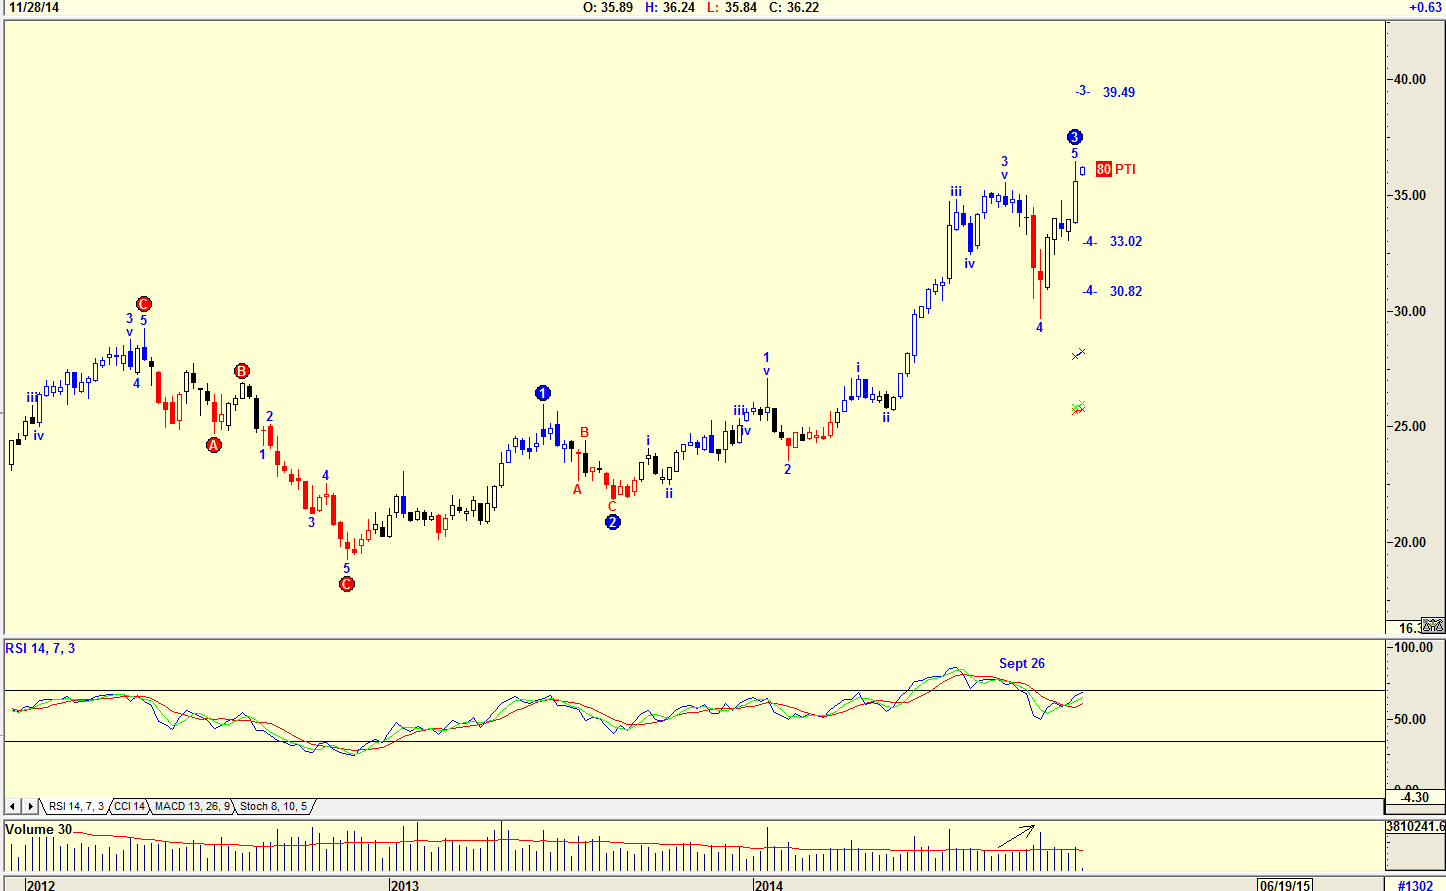
| Figure 1. Weekly Chart With Elliott Wave Count. There is an 80% probability the share price could rise to $39.40. |
| Graphic provided by: AdvancedGET. |
| |
| The chart in Figure 1 is a weekly chart with an Advanced GET Elliott Wave count suggesting that there is an 80% probability (80 PTI) that the share price could rise to $39.48. The chart is also suggesting that Wave 3 could be complete, and that the share price could fall into a Wave 4 bottoming at either $33.02 or $30.82. The relative strength index (RSI) which gave a sell signal on September 26, 2014 has been correcting upwards, but is it suggesting a buy? Note how volume strengthened as the share price fell, confirming weakness and as the share price rose, appears to be moving sideways. |
|
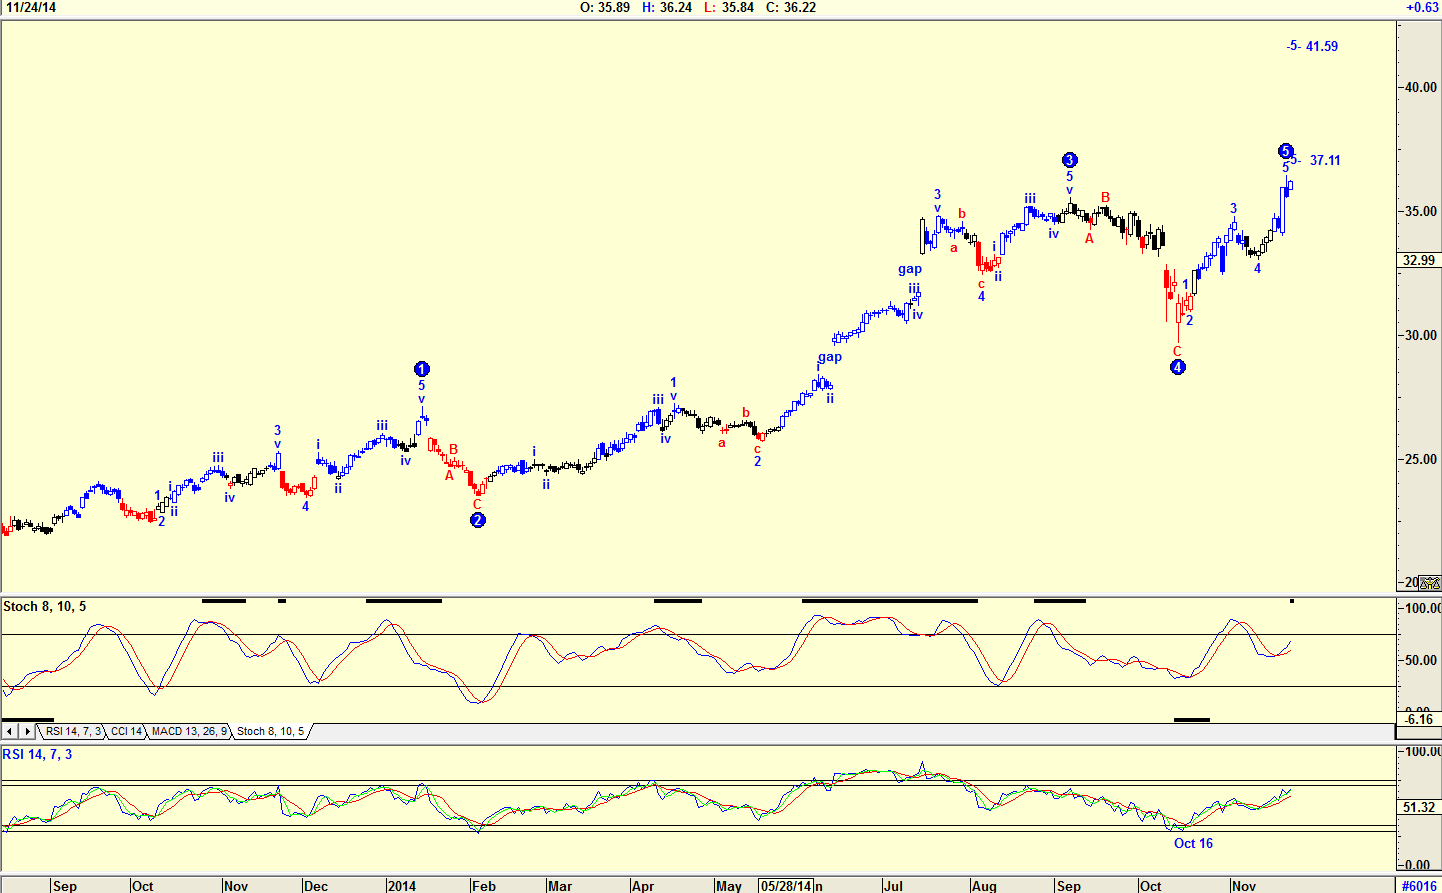
| Figure 2. Daily Chart With Elliott Wave Count. The price of Intel (INTC) could be topping out at $37.11 or could rise to $41.59. |
| Graphic provided by: AdvancedGET. |
| |
| The daily chart in Figure 2 has an Advanced GET Elliott Wave count suggesting that the share price could either be topping out at $37.11 in a WAVE 5 or could rise to $41.59. The stochastic indicator and the RSI are trending up. The RSI gave a buy on October 16, 2014 and is close to being at overbought levels. |
|
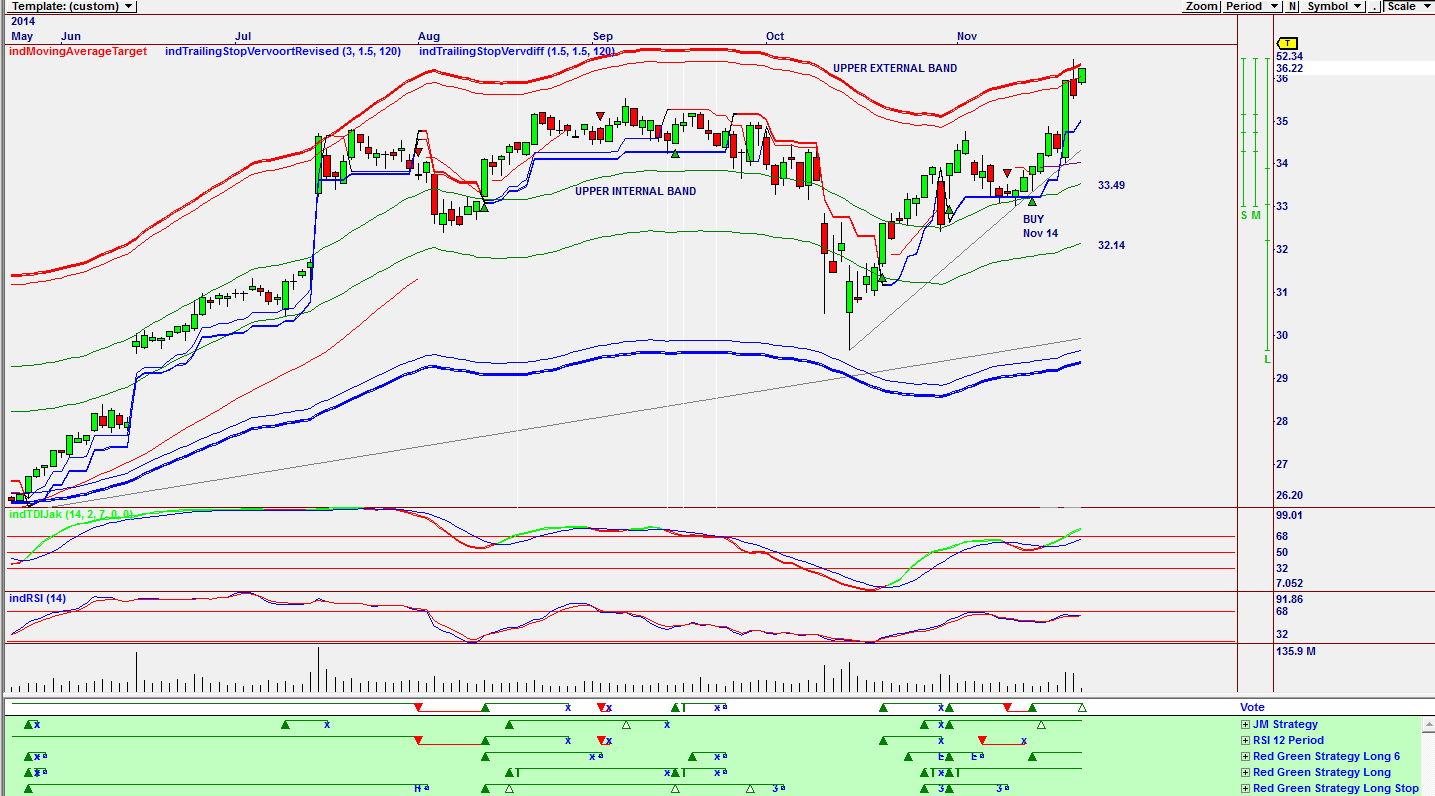
| Figure 3. Daily Omnitrader Chart. A buy signal was given on November 14, 2014 but given that the price of the stock is testing the upper band suggests caution. |
| Graphic provided by: Omnitrader. |
| |
| The chart in Figure 3 is an Omnitrader chart showing a buy signal given on November 14, 2014 based on the JM Strategy, the Red Green Strategy Long 6, and the Red Green Strategy Long. However, that the share price is testing the upper external band suggests caution. For the short-term with close stops I would be a buyer of INTC, but for the long-term, I would prefer sitting on the sidelines and waiting for the stock to fall in an ABC Elliott Wave correction. My target would be either the lower or upper internal band at $33.49 or $32.14. |
Has been a technical analyst since 1969, and has worked as a futures and options trader with First Financial Futures in Johannesburg, South Africa.
| Address: | 3256 West 24th Ave |
| Vancouver, BC | |
| Phone # for sales: | 6042634214 |
| E-mail address: | petroosp@gmail.com |
Click here for more information about our publications!
PRINT THIS ARTICLE

Request Information From Our Sponsors
- StockCharts.com, Inc.
- Candle Patterns
- Candlestick Charting Explained
- Intermarket Technical Analysis
- John Murphy on Chart Analysis
- John Murphy's Chart Pattern Recognition
- John Murphy's Market Message
- MurphyExplainsMarketAnalysis-Intermarket Analysis
- MurphyExplainsMarketAnalysis-Visual Analysis
- StockCharts.com
- Technical Analysis of the Financial Markets
- The Visual Investor
- VectorVest, Inc.
- Executive Premier Workshop
- One-Day Options Course
- OptionsPro
- Retirement Income Workshop
- Sure-Fire Trading Systems (VectorVest, Inc.)
- Trading as a Business Workshop
- VectorVest 7 EOD
- VectorVest 7 RealTime/IntraDay
- VectorVest AutoTester
- VectorVest Educational Services
- VectorVest OnLine
- VectorVest Options Analyzer
- VectorVest ProGraphics v6.0
- VectorVest ProTrader 7
- VectorVest RealTime Derby Tool
- VectorVest Simulator
- VectorVest Variator
- VectorVest Watchdog