HOT TOPICS LIST
- MACD
- Fibonacci
- RSI
- Gann
- ADXR
- Stochastics
- Volume
- Triangles
- Futures
- Cycles
- Volatility
- ZIGZAG
- MESA
- Retracement
- Aroon
INDICATORS LIST
LIST OF TOPICS
PRINT THIS ARTICLE
by Stella Osoba, CMT
What is anchoring and why do traders need to understand it?
Position: N/A
Stella Osoba, CMT
Stella Osoba is a trader and financial writer. She is a frequent contributor to "Technical Analysis of Stocks and Commodities" magazine and "Traders.com Advantage" as well as other financial publications.
PRINT THIS ARTICLE
PSYCHOLOGY
How Anchoring Can Hold Us Back
11/25/14 06:17:37 PMby Stella Osoba, CMT
What is anchoring and why do traders need to understand it?
Position: N/A
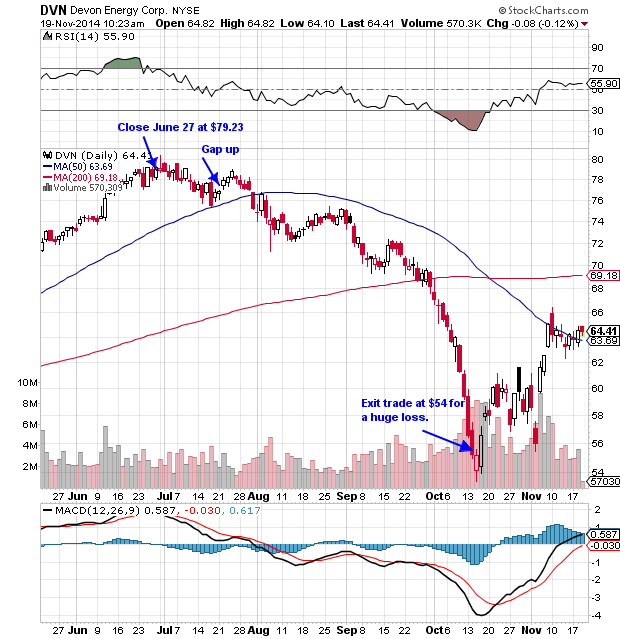
| Anchoring in financial markets is the cognitive bias that causes us to attach unwarranted importance to a random numerical figure or fact in forming projections about future outcomes. This bias in trading can cause us to lose sight of trading signals and hang on to positions too long as we wait for our anchor price to be reached. Anchoring is another dangerous and insidious cognitive bias. It is important to be aware of it and to understand how it can impact our trading decisions. Anchoring can work in the following way; you want to enter into a position in Devon Energy Corp. (DVN), maybe you have been watching the chart (see Figure 1), and you see that it has come off its recent highs. You watch as it makes a pull back to the 50-day moving average line and then bounce off that line. It gaps up on July 22, 2014 and you decide this is a good time to enter for a momentum trade. You enter the trade at $77, the price goes to $79 two days later, (July 24, 2014), and then reverses to the downside. You watch in shock as the price slips below the 50-day moving average. But you do not take the opportunity to get out of a bad trade for a reasonable controlled loss. Instead, you anchor to the price you got in at $77. You decide to wait until the shares reverse back to the upside and hit your entry price before you abandon the trade. With this decision made, you watch in increasing horror as the shares continue to slide. Finally, unable to bear the pain of mounting losses any further, you abandon the trade somewhere near $54 and the price makes a low the following day. |

|
| Figure 1. Devon Energy Corp. (DVN) Price gaps up on high volume on July 22, 2014. You buy on the gap up but price soon reverses to the downside. |
| Graphic provided by: StockCharts.com. |
| |
| Anchoring in trading means that we attach more significance to random numbers than we should. In this case our anchor is $77 or the price we entered the trade. But there is no reason for the market to treat this number with any deference or respect. If we were to take a cynical and unbiased look at the chart in Figure 1, after the fact, we would soon realize that there was no reason we should have even entered the trade at this number. It was too near a prior resistance, the moving average convergence divergence (MACD) had turned down and the signal line was above the MACD line. |
Stella Osoba is a trader and financial writer. She is a frequent contributor to "Technical Analysis of Stocks and Commodities" magazine and "Traders.com Advantage" as well as other financial publications.
| E-mail address: | stellaosoba@gmail.com |
Click here for more information about our publications!
PRINT THIS ARTICLE

Request Information From Our Sponsors
- StockCharts.com, Inc.
- Candle Patterns
- Candlestick Charting Explained
- Intermarket Technical Analysis
- John Murphy on Chart Analysis
- John Murphy's Chart Pattern Recognition
- John Murphy's Market Message
- MurphyExplainsMarketAnalysis-Intermarket Analysis
- MurphyExplainsMarketAnalysis-Visual Analysis
- StockCharts.com
- Technical Analysis of the Financial Markets
- The Visual Investor
- VectorVest, Inc.
- Executive Premier Workshop
- One-Day Options Course
- OptionsPro
- Retirement Income Workshop
- Sure-Fire Trading Systems (VectorVest, Inc.)
- Trading as a Business Workshop
- VectorVest 7 EOD
- VectorVest 7 RealTime/IntraDay
- VectorVest AutoTester
- VectorVest Educational Services
- VectorVest OnLine
- VectorVest Options Analyzer
- VectorVest ProGraphics v6.0
- VectorVest ProTrader 7
- VectorVest RealTime Derby Tool
- VectorVest Simulator
- VectorVest Variator
- VectorVest Watchdog
