HOT TOPICS LIST
- MACD
- Fibonacci
- RSI
- Gann
- ADXR
- Stochastics
- Volume
- Triangles
- Futures
- Cycles
- Volatility
- ZIGZAG
- MESA
- Retracement
- Aroon
INDICATORS LIST
LIST OF TOPICS
PRINT THIS ARTICLE
by Donald W. Pendergast, Jr.
Energy sector stocks are now in a prime position to recover even more of their recent losses.
Position: N/A
Donald W. Pendergast, Jr.
Freelance financial markets writer and online publisher of the Trendzetterz.com S&P 500 Weekly Forecast service.
PRINT THIS ARTICLE
CYCLES
XLE: Energy Stocks Set For Rally
11/25/14 06:07:20 PMby Donald W. Pendergast, Jr.
Energy sector stocks are now in a prime position to recover even more of their recent losses.
Position: N/A
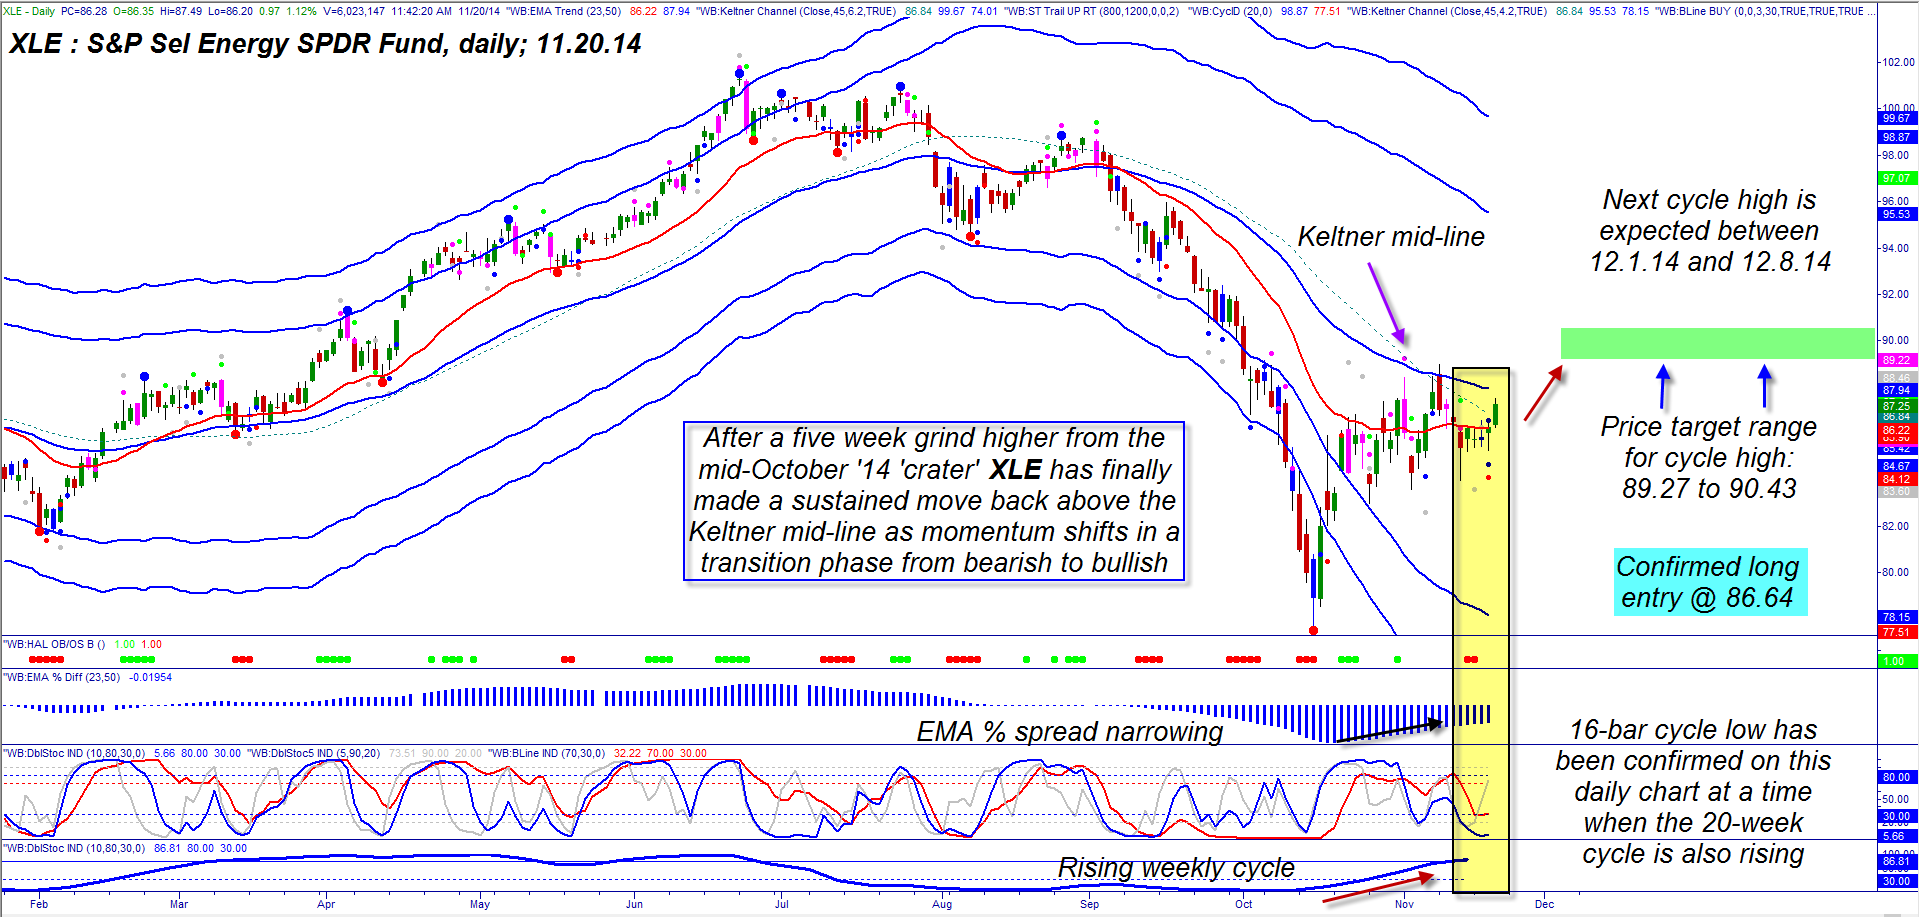
| With the entire globe now awash in excess crude oil supplies — a trend that may continue for several more years &mdas; short sellers really smashed the stocks within the oil exploration, integrated refiners and oil services between June and October 2014. But as is most always the case, the selling always gets overcooked at some point and a tradable bounce ensues. Here's a look at the interesting bullish reversal that is taking shape in XLE (S&P Select Energy SPDR Fund) right now (Figure 1). |

|
| Figure 1. S&P Select Energy SPDR Fund (XLE): When daily cycles bottom at a time when the weekly cycle is still rising, a low-risk long trade entry can result. This 16-bar cycle should run higher into the first week of December 2014. |
| Graphic provided by: TradeStation. |
| Graphic provided by: ProfitTrader7 from www.walterbressert.com. |
| |
| Crude oil's latest rout began in late June 2014, setting in motion the sharp sell-off in most US energy shares; XLE is the broad energy sector ETF that tracks the combined performance of all S&P 500 index (.SPY, SPY) energy stocks, and it was taken down by as much as 23.6% (a Fibonacci number) between June 23, 2014 and the major low of October 15, 2014. Note how the selling began to accelerate as the extreme lower Keltner band was breached a week before the final washout lows were achieved — truly a panic selling episode that is reminiscent of the kinds of market horror stories witness in 2000-2002 and more recently in 2007-2009. And while it's true that there is a super-abundant glut of crude oil, it's equally true that the selling was relatively overdone in comparison to the fair value of most of the large cap energy issues affected most. Five weeks after the major low, XLE was up by about 12% and looked to be ready to make the final launch out of a volatile yet bullish consolidation pattern, as detailed here: 1. XLE has finally made a strong move back above its Keltner channel midline (dashed line). 2. The spread between the red and blue EMA lines (exponential moving average) has been narrowing for the past three weeks, confirming the shift from a bearish to bullish phase. 3. The DBS5/10 and BLine cycle oscillators have confirmed the low of November 19, 2014 as the latest 16-bar cycle bottom. 4. The weekly chart price cycle (bottom of chart) is still rising, with plenty of room to run higher. 5. Calculating the next cycle top using detrended averages reveals a potential price target range of 89.27 to 90.43; this top is anticipated to occur between December 1, 2014 and December 8, 2014. 6. A defacto buy signal was issued at 86.64; the initial stop is near 85.23. While it's unknown if XLE will reach those price targets by early December 2014, it is clear that this is a valid long trade setup and one that has many cycle and momentum dynamics working in its favor. |

|
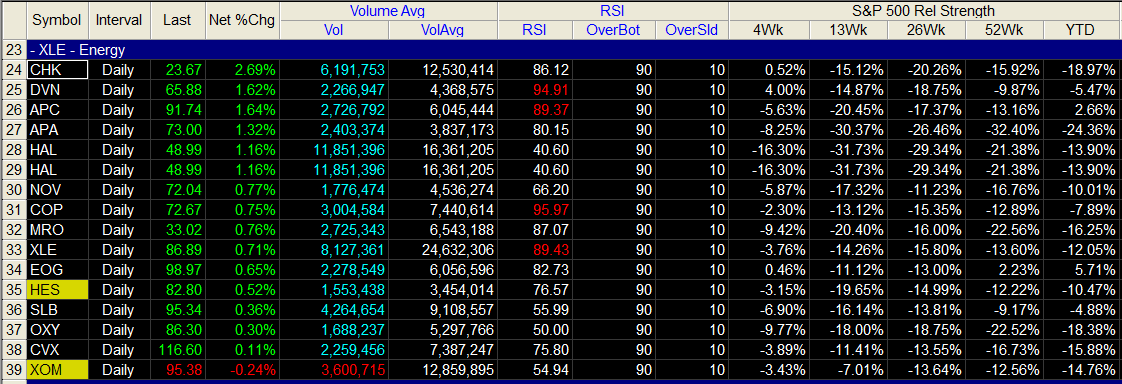
| Figure 2. Sector Performance. Nearly all of XLE's S&P 500 energy component stocks rally strongly on Thursday November 20, 2014. |
| Graphic provided by: TradeStation. |
| Graphic provided by: TradeStation 9.1 RadarScreen. |
| |
| The five energy sector stocks most correlated to XLE over the past calendar quarter are also performing well as this XLE buy signal continues to gain traction (performance for Thursday November 20, 2014): MRO +.95% APC +1.76% DVN +2.11% EOG +.80% HES +.73% Several of these stocks (see Figure 2)could even outperform XLE over the next few weeks, so be looking for prime long entry/re-entry points as their own bullish cycles and breakouts develop. Remember these are not trend following trade ideas but are near-term swing trades so be wise with your trailing stop and profit target/scale out protocols should any/all of them continue to rally. Keep your account risk at 1% or less and remember to trade wisely until we meet here again. |
Freelance financial markets writer and online publisher of the Trendzetterz.com S&P 500 Weekly Forecast service.
| Title: | Market consultant and writer |
| Company: | Trendzetterz |
| Address: | 81 Hickory Hollow Drive |
| Crossville, TN 38555 | |
| Phone # for sales: | 904-303-4814 |
| Website: | trendzetterz.com |
| E-mail address: | support@trendzetterz.com |
Traders' Resource Links | |
| Trendzetterz has not added any product or service information to TRADERS' RESOURCE. | |
Click here for more information about our publications!
Comments

Request Information From Our Sponsors
- StockCharts.com, Inc.
- Candle Patterns
- Candlestick Charting Explained
- Intermarket Technical Analysis
- John Murphy on Chart Analysis
- John Murphy's Chart Pattern Recognition
- John Murphy's Market Message
- MurphyExplainsMarketAnalysis-Intermarket Analysis
- MurphyExplainsMarketAnalysis-Visual Analysis
- StockCharts.com
- Technical Analysis of the Financial Markets
- The Visual Investor
- VectorVest, Inc.
- Executive Premier Workshop
- One-Day Options Course
- OptionsPro
- Retirement Income Workshop
- Sure-Fire Trading Systems (VectorVest, Inc.)
- Trading as a Business Workshop
- VectorVest 7 EOD
- VectorVest 7 RealTime/IntraDay
- VectorVest AutoTester
- VectorVest Educational Services
- VectorVest OnLine
- VectorVest Options Analyzer
- VectorVest ProGraphics v6.0
- VectorVest ProTrader 7
- VectorVest RealTime Derby Tool
- VectorVest Simulator
- VectorVest Variator
- VectorVest Watchdog
