

HOT TOPICS LIST
- MACD
- Fibonacci
- RSI
- Gann
- ADXR
- Stochastics
- Volume
- Triangles
- Futures
- Cycles
- Volatility
- ZIGZAG
- MESA
- Retracement
- Aroon
INDICATORS LIST
LIST OF TOPICS
PRINT THIS ARTICLE
by Donald W. Pendergast, Jr.
Up by more than 40% since the October lows, shares of Triquint Semiconductor may be set to go even higher.
Position: N/A
Donald W. Pendergast, Jr.
Freelance financial markets writer and online publisher of the Trendzetterz.com S&P 500 Weekly Forecast service.
PRINT THIS ARTICLE
CYCLES
TQNT: Important Trend And Cycle Juncture
11/21/14 04:51:35 PMby Donald W. Pendergast, Jr.
Up by more than 40% since the October lows, shares of Triquint Semiconductor may be set to go even higher.
Position: N/A
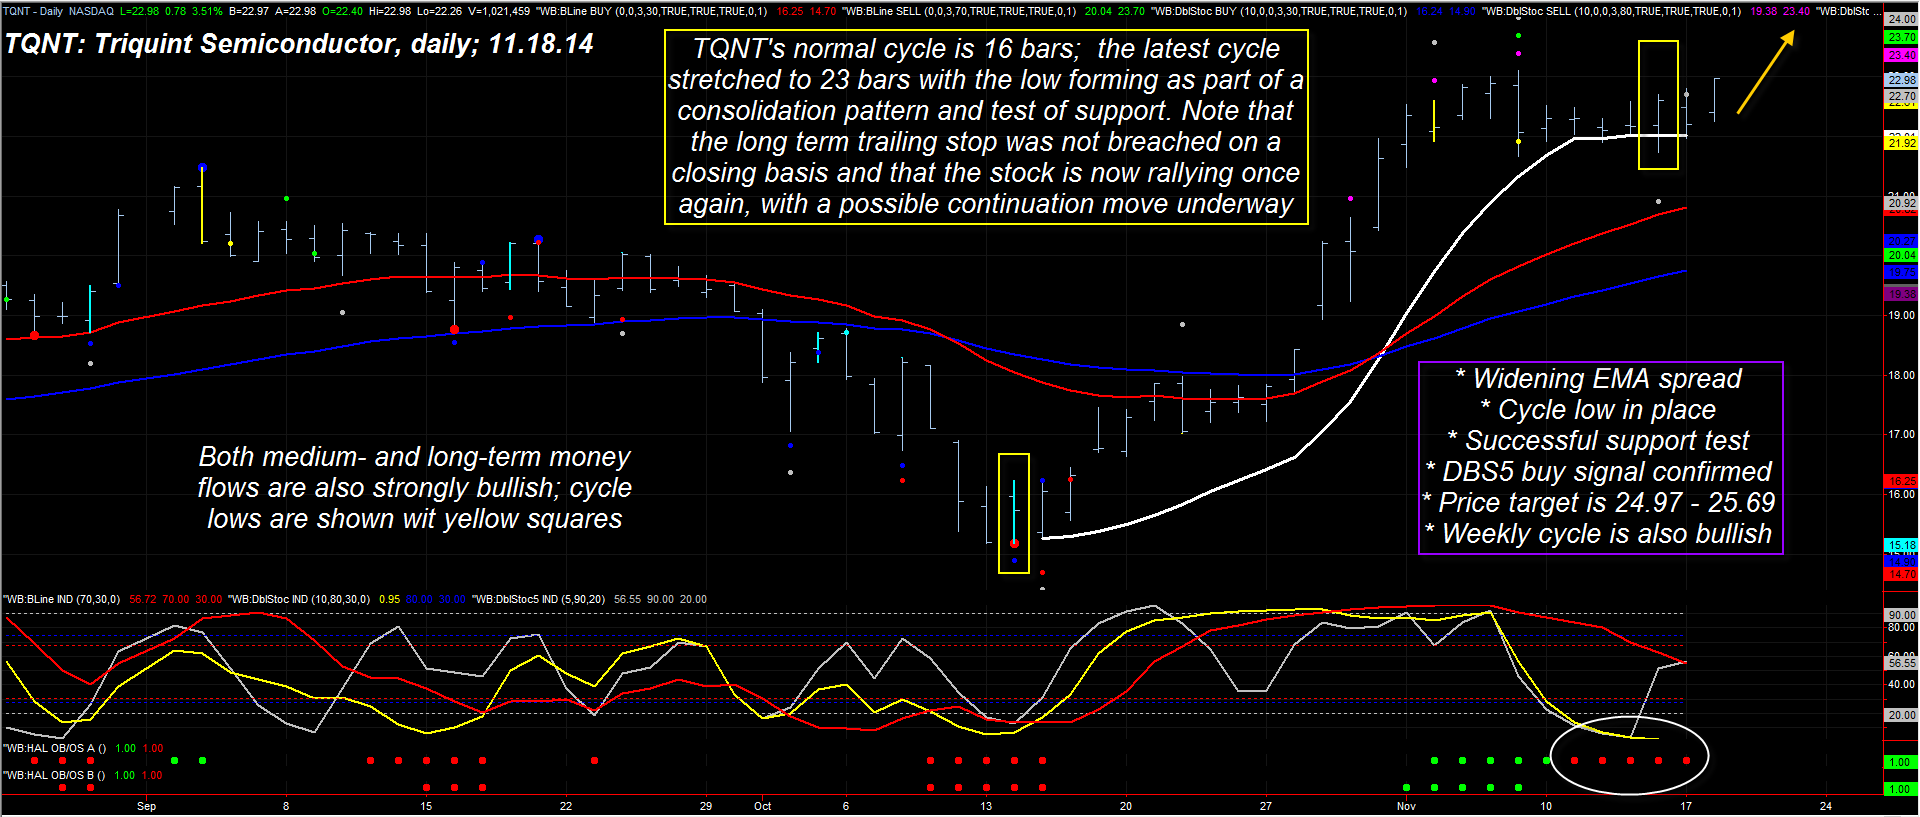
| When a stock makes a strong rally up from a major cycle low and then goes into a consolidation phase, traders need to look for telltale signs that may be forecasting a continuation move higher from the pattern, once complete. Here's a closer look at the major clues that suggest that shares of Triquint Semiconductor (TQNT) are preparing to rally up toward at least 25.00 in the next couple of weeks. |
|
| Figure 1. Upward Rally Ahead. Triquint Semiconductor (TQNT) appears to be in the early stages of a bullish continuation move that may take it to the mid-$25 price level within the next couple of weeks. |
| Graphic provided by: TradeStation. |
| Graphic provided by: ProfitTrader7 from www.walterbressert.com. |
| |
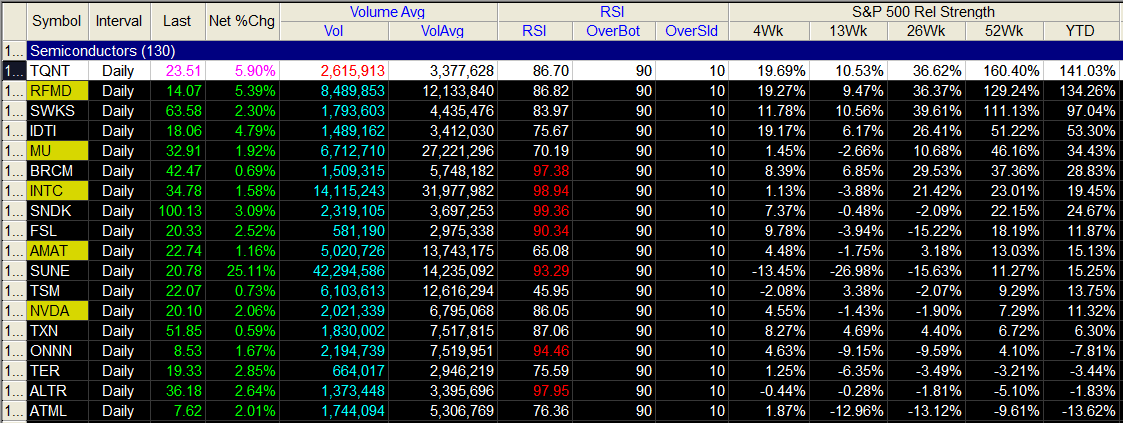
| Sometimes the analysis process in determining whether or not a stock is a good, low-risk trading candidate can be akin to that of solving a crossword puzzle; at a certain point, the majority — if not all — of the puzzle pieces begin to fall into place, and the solution (course of trading action) becomes crystal clear. Such is the case with this incredible chart pattern you now see for TQNT (Figure 1), one that is literally screaming 'rally underway' to those with eyes to see: 1. After bottoming a day ahead of the broad markets on October 14, 2014, TQNT surged by 45.6% in a mere 19 trading sessions. 2. After peaking on November 7, 2014 at 22.10, the stock made a shallow, gradual pullback that was part of a developing consolidation pattern; note that the white long-term trailing stop was never violated on a daily closing basis as the stock corrected the strong rally. The cycle low has also been completed as this occurred. 3. The spread between the red/blue exponential moving average (EMA) lines is widening &mdas; strong bullish momentum. 4. The 34- and 89-day Chaikin Money flow histograms (CMF)(89) are in bullish agreement. 5. A long DBS5 cycle entry was confirmed at $22.70 on November 17, 2014. 6. The weekly cycle oscillators are in bullish mode, with room to run higher. 7. A unique price cycle forecast has targeted the range from 24.97 to 25.69 as the probable termination zone for the current 16-day cycle. 8. If the rally gains strength, the cycle top won't occur until at least November 26, 2014 and may even take longer to top. 9. The next cycle low isn't due until at least December 1, 2014 and may finally bottom after December 4, 2014. 10. TQNT is far outperforming the S&P 500 index (.SPX) and its peers in the semiconductor industry group over the past year. |
|
| Figure 2. Relative Performance. TQNT has extraordinarily bullish relative strength vs. the S&P 500 index over the past year, and is also outperforming its peers in the semiconductor industry group. |
| Graphic provided by: TradeStation. |
| Graphic provided by: TradeStation 9.1 RadarScreen. |
| |
| With TQNT possibly having a $2 per share rally underway, aggressive traders can jump in now or perhaps wait for a minor 15- to 30-minute pullback to time a long swing entry. Once in, a two-bar trailing stop of the daily lows can be a good, common sense way to manage a position; if TQNT gets up close to 25.00, consider taking partial profits and if it surpasses 25.40, start protecting the position more aggressively should it continue to march higher to the upper target of 25.69. This is a low-risk high probability trade, to be sure, but remember to keep your account risk at no more than 1-2%, depending on your skill level as a trader. Options are not viable for this trade setup, as the bid-ask spread in TQNT puts and calls are poor, FYI. Trade wisely until we meet here again. |
Freelance financial markets writer and online publisher of the Trendzetterz.com S&P 500 Weekly Forecast service.
| Title: | Market consultant and writer |
| Company: | Trendzetterz |
| Address: | 81 Hickory Hollow Drive |
| Crossville, TN 38555 | |
| Phone # for sales: | 904-303-4814 |
| Website: | trendzetterz.com |
| E-mail address: | support@trendzetterz.com |
Traders' Resource Links | |
| Trendzetterz has not added any product or service information to TRADERS' RESOURCE. | |
Click here for more information about our publications!
PRINT THIS ARTICLE

Request Information From Our Sponsors
- StockCharts.com, Inc.
- Candle Patterns
- Candlestick Charting Explained
- Intermarket Technical Analysis
- John Murphy on Chart Analysis
- John Murphy's Chart Pattern Recognition
- John Murphy's Market Message
- MurphyExplainsMarketAnalysis-Intermarket Analysis
- MurphyExplainsMarketAnalysis-Visual Analysis
- StockCharts.com
- Technical Analysis of the Financial Markets
- The Visual Investor
- VectorVest, Inc.
- Executive Premier Workshop
- One-Day Options Course
- OptionsPro
- Retirement Income Workshop
- Sure-Fire Trading Systems (VectorVest, Inc.)
- Trading as a Business Workshop
- VectorVest 7 EOD
- VectorVest 7 RealTime/IntraDay
- VectorVest AutoTester
- VectorVest Educational Services
- VectorVest OnLine
- VectorVest Options Analyzer
- VectorVest ProGraphics v6.0
- VectorVest ProTrader 7
- VectorVest RealTime Derby Tool
- VectorVest Simulator
- VectorVest Variator
- VectorVest Watchdog