HOT TOPICS LIST
- MACD
- Fibonacci
- RSI
- Gann
- ADXR
- Stochastics
- Volume
- Triangles
- Futures
- Cycles
- Volatility
- ZIGZAG
- MESA
- Retracement
- Aroon
INDICATORS LIST
LIST OF TOPICS
PRINT THIS ARTICLE
by Koos van der Merwe
Shares of Zoetis, Inc. have recently gained 7%. Are they worth buying now?
Position: Sell
Koos van der Merwe
Has been a technical analyst since 1969, and has worked as a futures and options trader with First Financial Futures in Johannesburg, South Africa.
PRINT THIS ARTICLE
ELLIOTT WAVE
Zoetis, Inc.
11/19/14 04:41:16 PMby Koos van der Merwe
Shares of Zoetis, Inc. have recently gained 7%. Are they worth buying now?
Position: Sell
| On November 14, 2014 Reuters announced that Zoetis, Inc. (ZTS) adopted a poison pill after Bill Ackman's Pershing Square Capital Holdings revealed a stake in the company. Shares of the company gained seven percent since the stake Ackman holds in the company was announced. Is it worth buying the stock now? What do the charts say? |

|
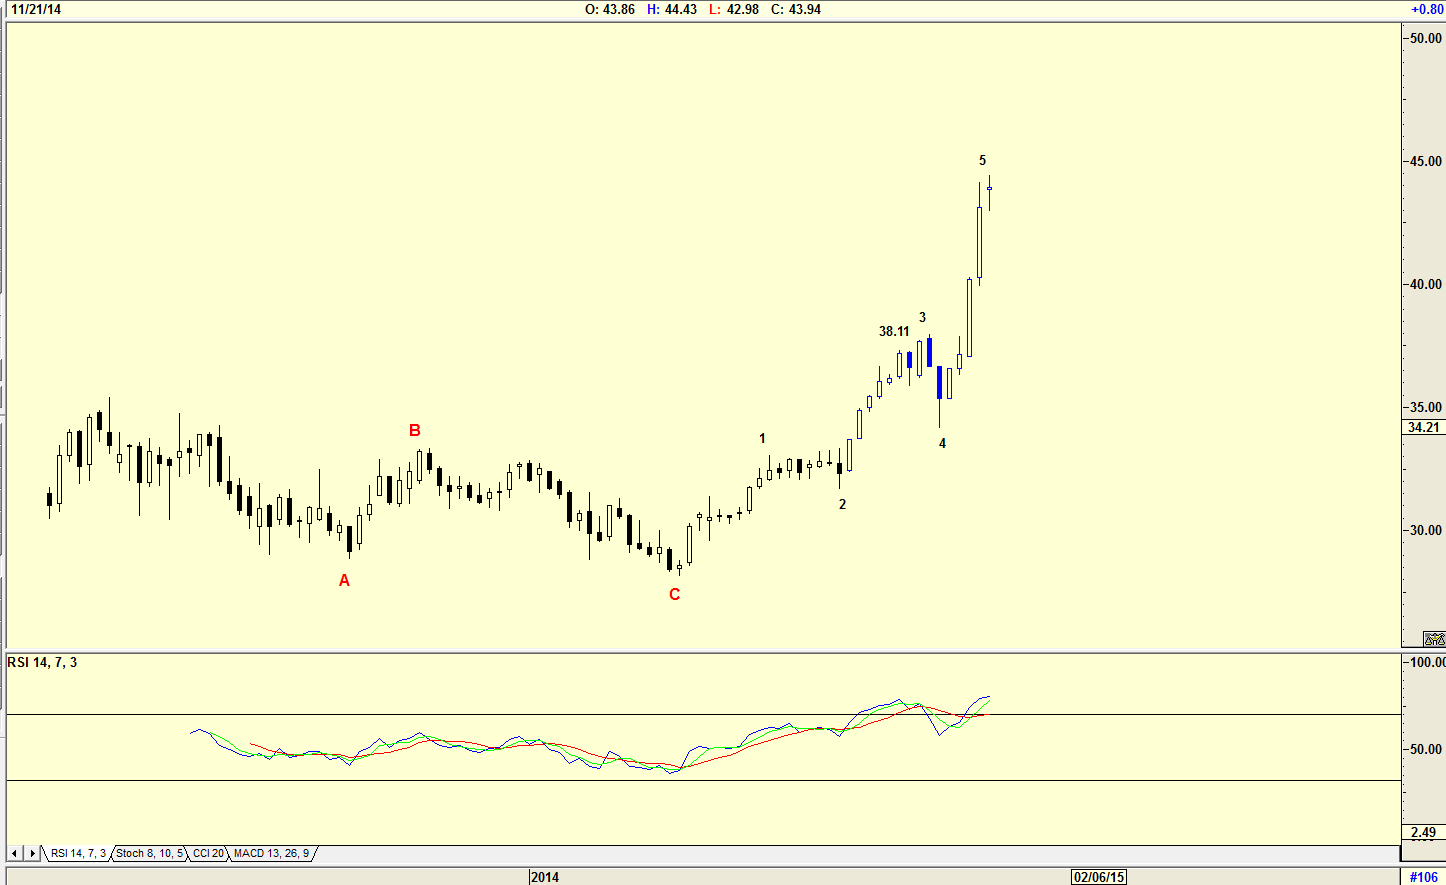
| Figure 1. Weekly Chart With Elliott Wave Count. The stock price is completing a WAVE 5 and should be correction possibly to the $38.11 level, the fourth wave of lesser degree. |
| Graphic provided by: AdvancedGET. |
| |
| The chart in Figure 1 is a weekly chart with an Elliott Wave count suggesting that the share price is completing a WAVE 5 and should be correcting possibly to the $38.11 level, the fourth wave of lesser degree. The overbought relative strength index (RSI) is suggesting that this correction will occur. |

|
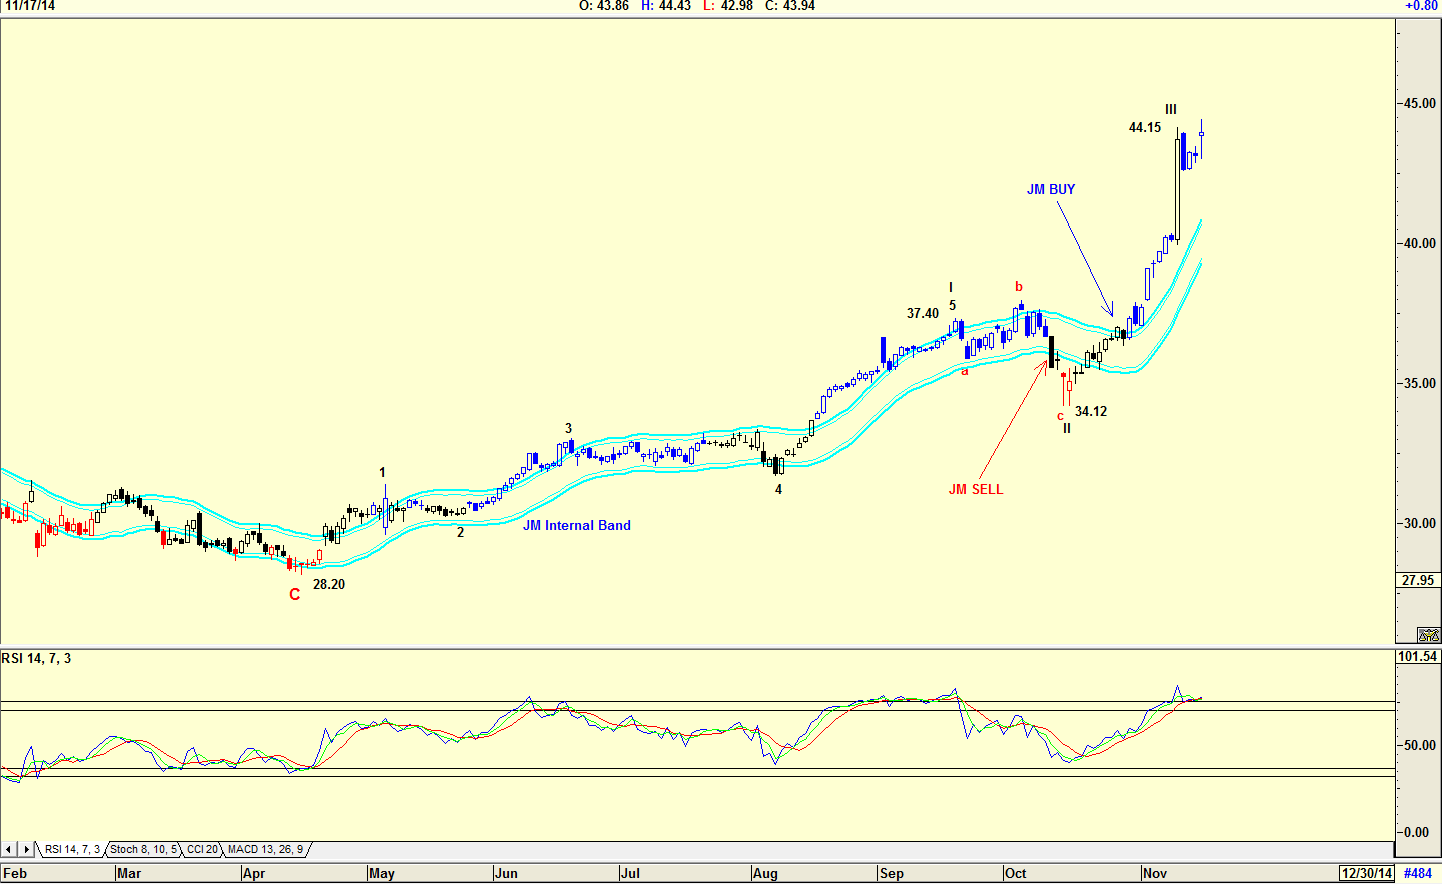
| Figure 2. Daily chart With Elliott Wave Count. Looking at this chart, it looks like a correction is due as suggested by the Elliott Wave count and the relative strength index (RSI). |
| Graphic provided by: AdvancedGET. |
| |
| The daily chart in Figure 2 shows an Elliott Wave count with Wave I being $9.20 in length (37.40-28.20=9.20). This means that Wave III should be equal to or greater than $9.20 in length. Should it be less than $9.20 in length, then Wave V will be less than Wave III in length. Wave III is $10.03 in length, (44.15-34.12=10.03), so the chart suggesting a Wave III top could be correct. Should the share price move higher, then the top of Wave III will rise. One should never forget that an Elliott Wave count is purely a signpost in the wilderness, and the count can change as the share price moves. The RSI at overbought levels is however suggesting a correction is due. Should the correction occur as suggested by the RSI, it should be a Wave IV correction, and should not fall below the $37.40 level. Wave II shown in the chart looks like a complicated correction, which means that Wave IV should be a simple or more complicated correction. Note the JM Internal Band. The JM Internal Band is a 15-period simple moving average offset by 2% positive and 2% negative. A move above the upper band signals a buy, and below the lover band a sell. I would not be a buyer of ZTS at the present price. I would prefer waiting for a correction to occur with the RSI dropping below the 70 horizontal line and suggesting a sell. |
Has been a technical analyst since 1969, and has worked as a futures and options trader with First Financial Futures in Johannesburg, South Africa.
| Address: | 3256 West 24th Ave |
| Vancouver, BC | |
| Phone # for sales: | 6042634214 |
| E-mail address: | petroosp@gmail.com |
Click here for more information about our publications!
PRINT THIS ARTICLE

Request Information From Our Sponsors
- StockCharts.com, Inc.
- Candle Patterns
- Candlestick Charting Explained
- Intermarket Technical Analysis
- John Murphy on Chart Analysis
- John Murphy's Chart Pattern Recognition
- John Murphy's Market Message
- MurphyExplainsMarketAnalysis-Intermarket Analysis
- MurphyExplainsMarketAnalysis-Visual Analysis
- StockCharts.com
- Technical Analysis of the Financial Markets
- The Visual Investor
- VectorVest, Inc.
- Executive Premier Workshop
- One-Day Options Course
- OptionsPro
- Retirement Income Workshop
- Sure-Fire Trading Systems (VectorVest, Inc.)
- Trading as a Business Workshop
- VectorVest 7 EOD
- VectorVest 7 RealTime/IntraDay
- VectorVest AutoTester
- VectorVest Educational Services
- VectorVest OnLine
- VectorVest Options Analyzer
- VectorVest ProGraphics v6.0
- VectorVest ProTrader 7
- VectorVest RealTime Derby Tool
- VectorVest Simulator
- VectorVest Variator
- VectorVest Watchdog
