

HOT TOPICS LIST
- MACD
- Fibonacci
- RSI
- Gann
- ADXR
- Stochastics
- Volume
- Triangles
- Futures
- Cycles
- Volatility
- ZIGZAG
- MESA
- Retracement
- Aroon
INDICATORS LIST
LIST OF TOPICS
PRINT THIS ARTICLE
by Donald W. Pendergast, Jr.
Shares of Apple, Inc. may be overextended, preparing for a pullback.
Position: N/A
Donald W. Pendergast, Jr.
Freelance financial markets writer and online publisher of the Trendzetterz.com S&P 500 Weekly Forecast service.
PRINT THIS ARTICLE
KELTNER CHANNELS
AAPL: Recipe For A Reversal?
11/19/14 04:30:53 PMby Donald W. Pendergast, Jr.
Shares of Apple, Inc. may be overextended, preparing for a pullback.
Position: N/A
| Apple, Inc.'s (AAPL) sharp rally since the October 2014 lows has been powering the Nasdaq 100 index (.NDX, QQQ) ever higher, but with the stock now trading at or above its topmost Keltner band, a correction becomes very probable. Here's a closer look now. |
|
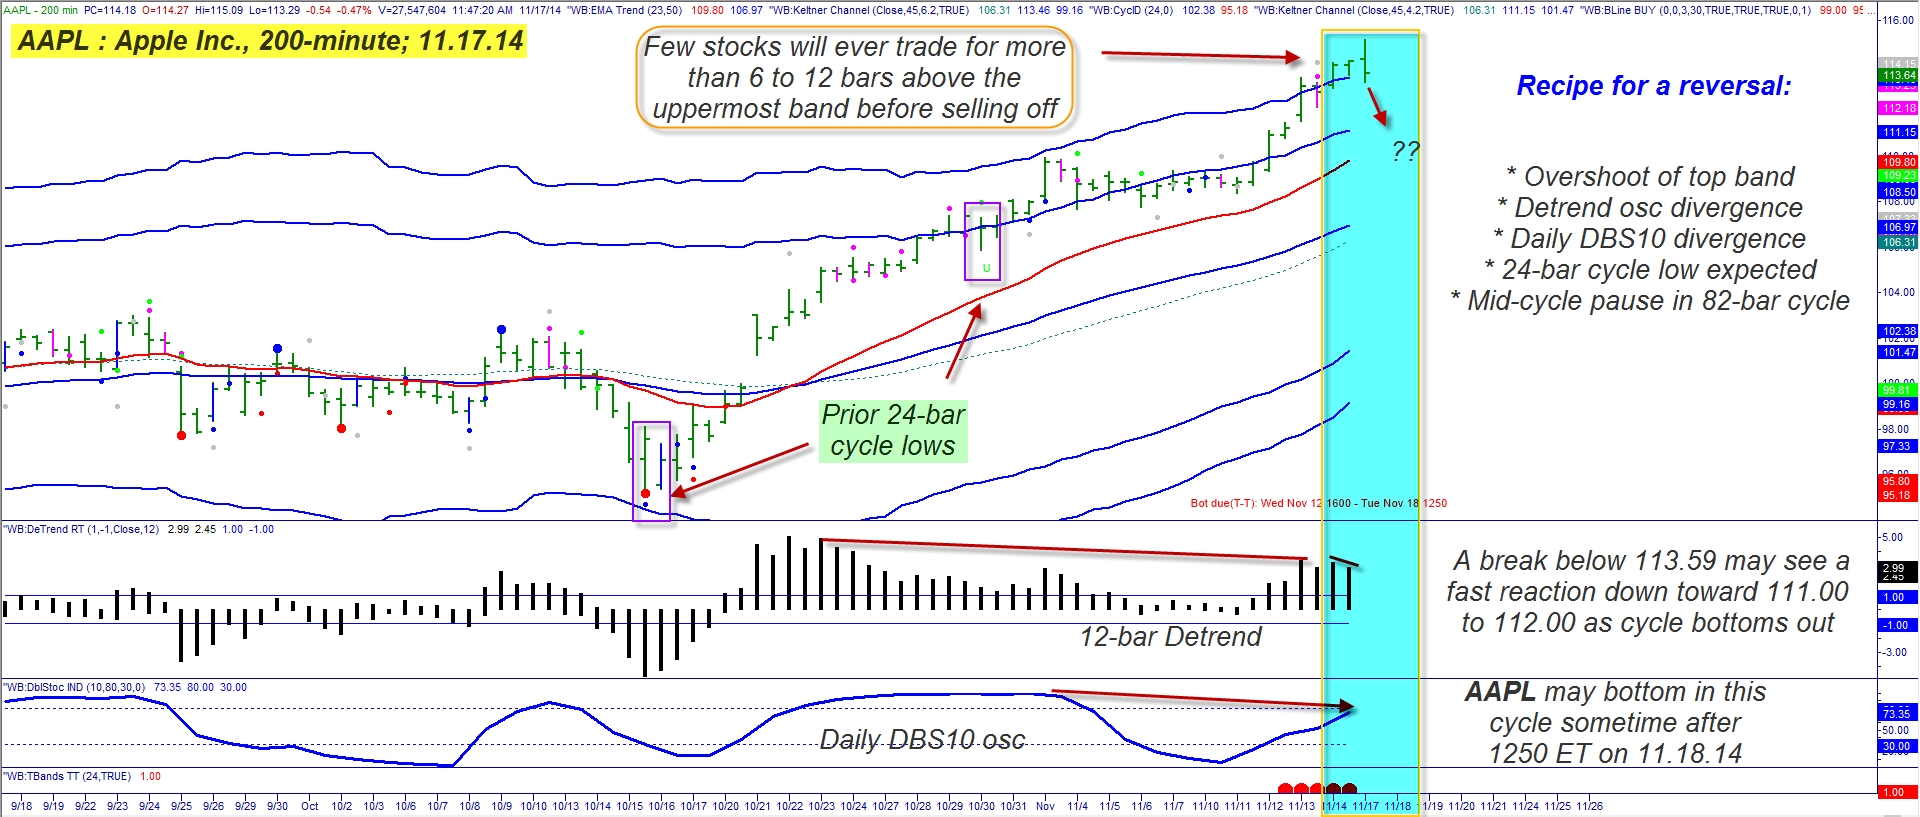
| Figure 1. Upswings In Apple. On this 200-minute chart of Apple Inc. (AAPL); you can see that the stock rallied by 21% coming out of its October 15, 2014 low, but that rally may now be at exhaustion phase. A pullback into its next 24-bar cycle low is due within the next few trading sessions. |
| Graphic provided by: TradeStation. |
| Graphic provided by: ProfitTrader7 from www.walterbressert.com. |
| |
| A 21% rally in only four to five weeks is a great performance for a giant-cap stock like AAPL, and based on long-term cycles and fundamental metrics, the company — and its stock — should continue to perform well for many years to come. But swing traders aren't necessarily motivated by sales growth or earnings growth stats; they focus instead on the stock's ability to make sustainable, tradable moves that put cash into their accounts. Looking at AAPL's 200-minute chart in Figure 1, we find that there have been two distinct upswings since October 15, 2014 — both being driven by the dominant 24-bar cycle for this time frame. The first thrust higher was the most powerful, not bottoming until 21 bars after the major low (see boxes on chart); this occurred on October 30, 2014 at 12:50 ET, after which the stock began to rally again, although at a slower, less purposeful pace. The peak of this second 24-bar cycle looks to have topped at bar 22 on Monday morning, October 17, 2014 at a price of 115.09; AAPL has spent five of the past 200-minute price bars trading above its extreme upper Keltner band at a time when it is in overbought territory. Other clues that a near term reversal are due/overdue: 1. The 12-period detrend histogram keeps making lower highs — at two different degrees of trend — as the stock enters a high probability turning point. 2. The cycle oscillator at the bottom of the chart is based on the daily chart price action; although the cycle is clearly bullish, note that its current treading falls far short of the level it reached at the November 3, 2014 swing high (also near the uppermost Keltner band). This is another substantial bearish divergence warning to be aware of. 3. The 21-, 55- and 89-bar Chaikin Money Flow histograms (CMF)(89) all reveal serious bearish price/money flow divergences. 4. The next 24-bar cycle low time window is due sometime after 1250 ET on November 18, 2014 (red horizontal dots); if this is a significant pullback developing, expect the date/time of the cycle bottom to appear somewhat later. All in all, these are all valid reversal recipe ingredients for AAPL; in many ways as goes AAPL, so goes the entire Nasdaq 100 index (.NDX, QQQ), so this setup could also be viewed as a proxy for the index (Figure 2). Anyone currently long from either the October 15 or October 30 cycle lows should be using a close trailing stop and/or have already begun to scale out of long swing positions. |
|
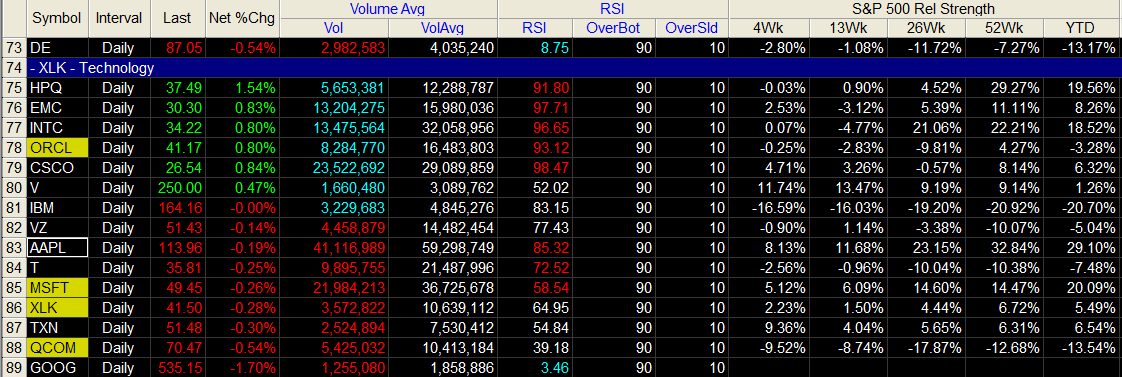
| Figure 2. Comparing AAPL To The Tech Sector. Technology sector stocks turn in a mixed performance on November 17, 2014; AAPL is down .20% on the session after retreating from an extreme overbought condition earlier in the day. |
| Graphic provided by: TradeStation. |
| Graphic provided by: TradeStation RadarScreen. |
| |
| The S&P 500 index (.SPX, SPY) is at an important cycle/trend juncture now; it's either in a momentary (one to three week) pause before another minor rally and subsequent nasty correction or it's simply resting for a week or two before running higher for the next four to eight weeks — possibly as high as 214.00-222.00 (SPY). QQQ also has a similar price cycle structure, making the weeks ahead for AAPL of prime importance to traders. Whichever scenario plays out in SPY/QQQ will most surely affect the price action in AAPL, so be prepared for either scenario in the weeks ahead. For now, speculative bears can go short AAPL on a drop below 113.59, looking to cover down near 111.50-112.10 which could offer the first Keltner support zone for the 200-minute, 24-bar price cycle to make a solid low. Below that moving average support near 110.00 should also be able to halt any declines, even if only temporarily. Keep your account risks small and remember to trade wisely until we meet here again. |
Freelance financial markets writer and online publisher of the Trendzetterz.com S&P 500 Weekly Forecast service.
| Title: | Market consultant and writer |
| Company: | Trendzetterz |
| Address: | 81 Hickory Hollow Drive |
| Crossville, TN 38555 | |
| Phone # for sales: | 904-303-4814 |
| Website: | trendzetterz.com |
| E-mail address: | support@trendzetterz.com |
Traders' Resource Links | |
| Trendzetterz has not added any product or service information to TRADERS' RESOURCE. | |
Click here for more information about our publications!
PRINT THIS ARTICLE

Request Information From Our Sponsors
- StockCharts.com, Inc.
- Candle Patterns
- Candlestick Charting Explained
- Intermarket Technical Analysis
- John Murphy on Chart Analysis
- John Murphy's Chart Pattern Recognition
- John Murphy's Market Message
- MurphyExplainsMarketAnalysis-Intermarket Analysis
- MurphyExplainsMarketAnalysis-Visual Analysis
- StockCharts.com
- Technical Analysis of the Financial Markets
- The Visual Investor
- VectorVest, Inc.
- Executive Premier Workshop
- One-Day Options Course
- OptionsPro
- Retirement Income Workshop
- Sure-Fire Trading Systems (VectorVest, Inc.)
- Trading as a Business Workshop
- VectorVest 7 EOD
- VectorVest 7 RealTime/IntraDay
- VectorVest AutoTester
- VectorVest Educational Services
- VectorVest OnLine
- VectorVest Options Analyzer
- VectorVest ProGraphics v6.0
- VectorVest ProTrader 7
- VectorVest RealTime Derby Tool
- VectorVest Simulator
- VectorVest Variator
- VectorVest Watchdog