HOT TOPICS LIST
- MACD
- Fibonacci
- RSI
- Gann
- ADXR
- Stochastics
- Volume
- Triangles
- Futures
- Cycles
- Volatility
- ZIGZAG
- MESA
- Retracement
- Aroon
INDICATORS LIST
LIST OF TOPICS
PRINT THIS ARTICLE
by Thomas Bopp
The stock price of Visa, Inc. has been on the long-term buy list for the past month. The stock rose more than 20 percent within the last three weeks. Is the stock ripe for a correction or is more upside possible?
Position: Accumulate
Thomas Bopp
Thomas Bopp has more than 25 years experience in all kinds of trading. He mainly trades options on the short-side based on his own unique trading systems. He is also responsible for a German and Spanish free daily market newsletter, which covers the S&P 500, Ibex 35, DAX and German Bund-Future.
PRINT THIS ARTICLE
TECHNICAL ANALYSIS
Long-Term Target Of Visa, Inc.
11/19/14 04:00:04 PMby Thomas Bopp
The stock price of Visa, Inc. has been on the long-term buy list for the past month. The stock rose more than 20 percent within the last three weeks. Is the stock ripe for a correction or is more upside possible?
Position: Accumulate
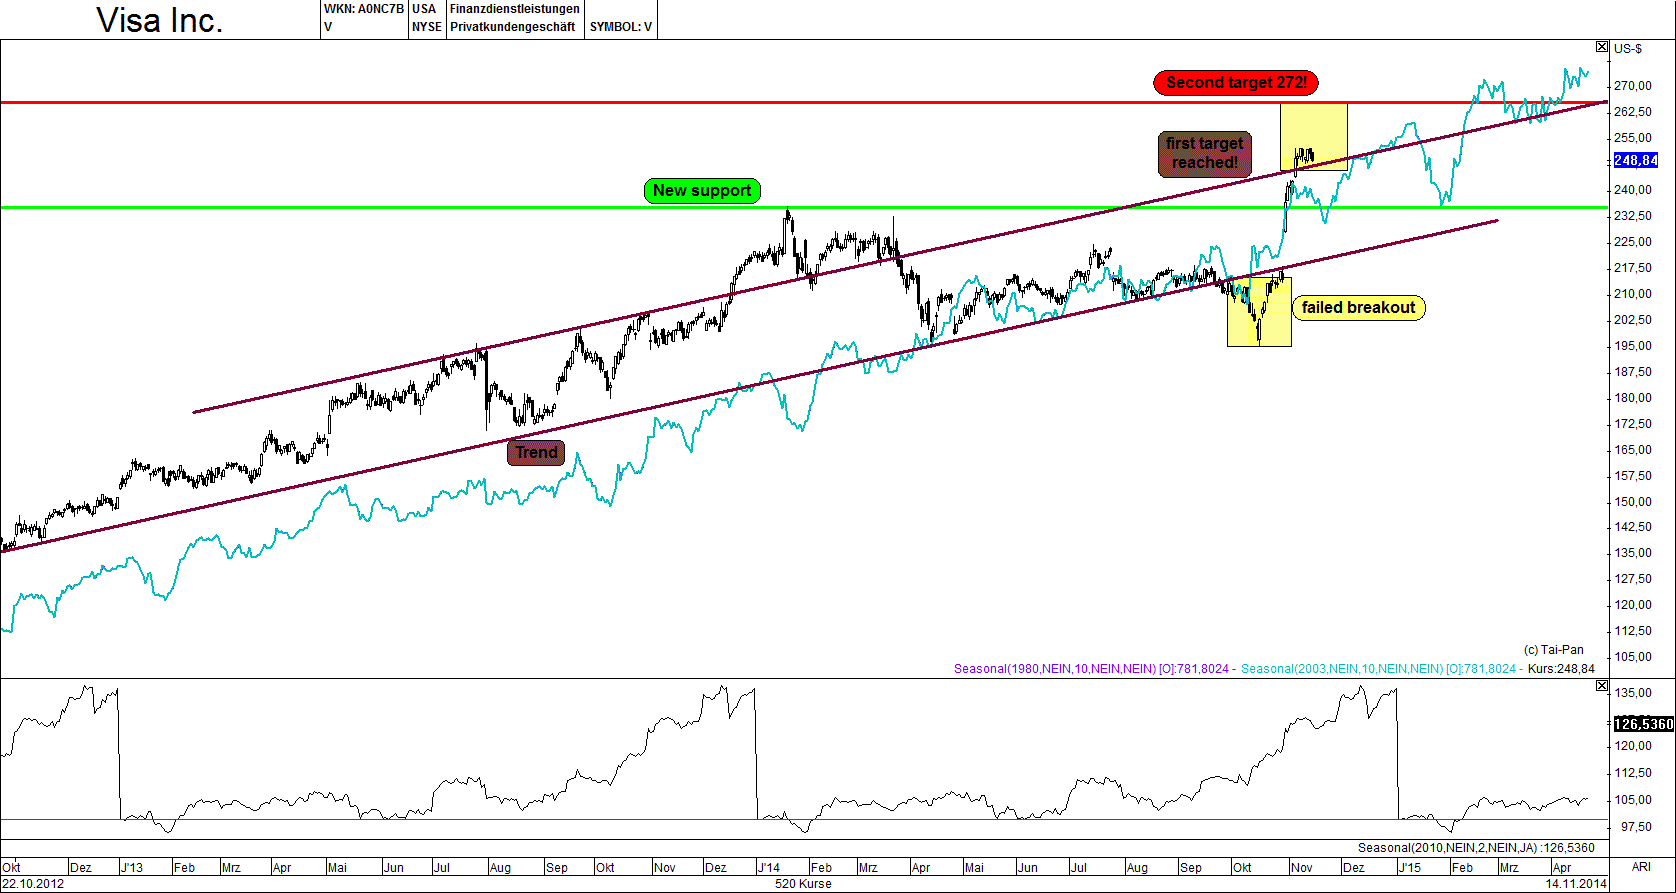
| Before making a gap to the upside, the stock price of Visa, Inc. (V) had already started rising. The seasonal line you see on the chart in Figure 1 is showing an upward move until February 2015. From a technical view the move should move up to at least $247, especially after the breakout over the red resistance line was confirmed three weeks ago. |

|
| Figure 1. Price Breakout. The price of Amazon, Inc. (AMZN) breaks out on high volume on July 11, 2014. This prompts you to buy but fail to notice that price is rising on declining volume. Do you continue to hold or do you sell? |
| Graphic provided by: www.lp-software.de. |
| |
| False breakouts always give hints on how far the move could go in the opposite direction. V crossed the uptrend, but made a comeback to new highs. The stock price has now reached the yellow shaded area at the upper resistance line. The first target was crossed and now the next target on the daily timeframe is $272. |
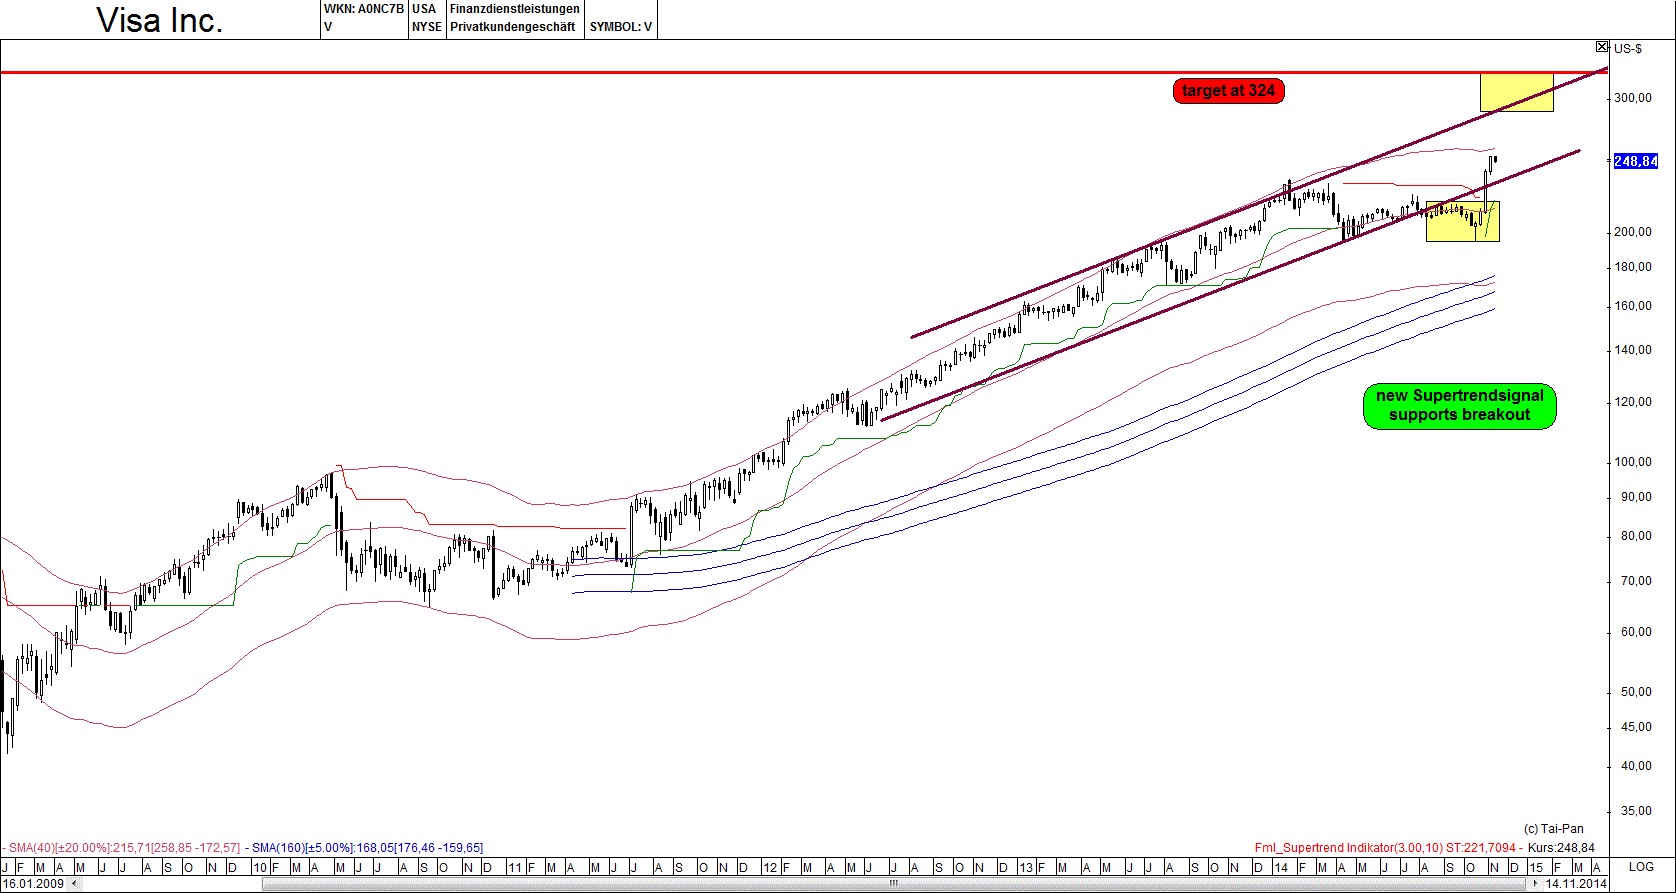
| More possible opportunities are presented when you use the same technique on the weekly chart (Figure 2). A price target of $324 is possible in the coming months. The supertrend indicator was crossed last week and gave a new buy signal. The supertrend indicator was developed by Olivier Seban and uses the stop & reverse system similar to Welles Wilders' parabolic SAR system. The supertrend indicator combines price range and volatility. Average true range (ATR) is used as a measure and will be multiplied with a constant factor, in this case three. Therefore the position is always long or short. |

|
| Figure 2. False breakouts usually give room for upside magnitude. Therefore long-term investors could look for a good entry, preparing them for the next move to $324. |
| Graphic provided by: www.lp-software.de. |
| |
| The last buy signal based on the supertrend indicator was given at $85 in January 2012. After this the stock traded sideways for a couple of weeks, before V rose more than 200%. We won't know if the stock price will perform in a similar way this time until a year has passed. Two things could now happen: the stock could run up further or consolidate within the trend and move sideways for some weeks offering long-term investors a good entry phase at a lower price level. If you do hop on the running train, I recommend you use a stop at $224. Using the same technique as in the daily timeframe, $324 is the long-term target. If you hold the stock till it reaches $324, it's a risk reward ratio of three. |
Thomas Bopp has more than 25 years experience in all kinds of trading. He mainly trades options on the short-side based on his own unique trading systems. He is also responsible for a German and Spanish free daily market newsletter, which covers the S&P 500, Ibex 35, DAX and German Bund-Future.
| Title: | Freelance trader and analyst |
| Company: | Bopp's Financial Market Studies |
| Address: | Eichendorffweg 6 |
| 61194 Niddatal, Germany, 61194 | |
| Phone # for sales: | +49 60347961 |
| E-mail address: | webmaster@zyklusanalyst.de |
Traders' Resource Links | |
| Bopp's Financial Market Studies has not added any product or service information to TRADERS' RESOURCE. | |
Click here for more information about our publications!
PRINT THIS ARTICLE

Request Information From Our Sponsors
- StockCharts.com, Inc.
- Candle Patterns
- Candlestick Charting Explained
- Intermarket Technical Analysis
- John Murphy on Chart Analysis
- John Murphy's Chart Pattern Recognition
- John Murphy's Market Message
- MurphyExplainsMarketAnalysis-Intermarket Analysis
- MurphyExplainsMarketAnalysis-Visual Analysis
- StockCharts.com
- Technical Analysis of the Financial Markets
- The Visual Investor
- VectorVest, Inc.
- Executive Premier Workshop
- One-Day Options Course
- OptionsPro
- Retirement Income Workshop
- Sure-Fire Trading Systems (VectorVest, Inc.)
- Trading as a Business Workshop
- VectorVest 7 EOD
- VectorVest 7 RealTime/IntraDay
- VectorVest AutoTester
- VectorVest Educational Services
- VectorVest OnLine
- VectorVest Options Analyzer
- VectorVest ProGraphics v6.0
- VectorVest ProTrader 7
- VectorVest RealTime Derby Tool
- VectorVest Simulator
- VectorVest Variator
- VectorVest Watchdog
