

HOT TOPICS LIST
- MACD
- Fibonacci
- RSI
- Gann
- ADXR
- Stochastics
- Volume
- Triangles
- Futures
- Cycles
- Volatility
- ZIGZAG
- MESA
- Retracement
- Aroon
INDICATORS LIST
LIST OF TOPICS
PRINT THIS ARTICLE
by Donald W. Pendergast, Jr.
Shares of Lockheed Martin make a picture perfect cycle low, rallying on a chaotic day in the broad markets.
Position: N/A
Donald W. Pendergast, Jr.
Freelance financial markets writer and online publisher of the Trendzetterz.com S&P 500 Weekly Forecast service.
PRINT THIS ARTICLE
CYCLES
LMT: Cycle Low Right On Time
11/17/14 04:54:56 PMby Donald W. Pendergast, Jr.
Shares of Lockheed Martin make a picture perfect cycle low, rallying on a chaotic day in the broad markets.
Position: N/A
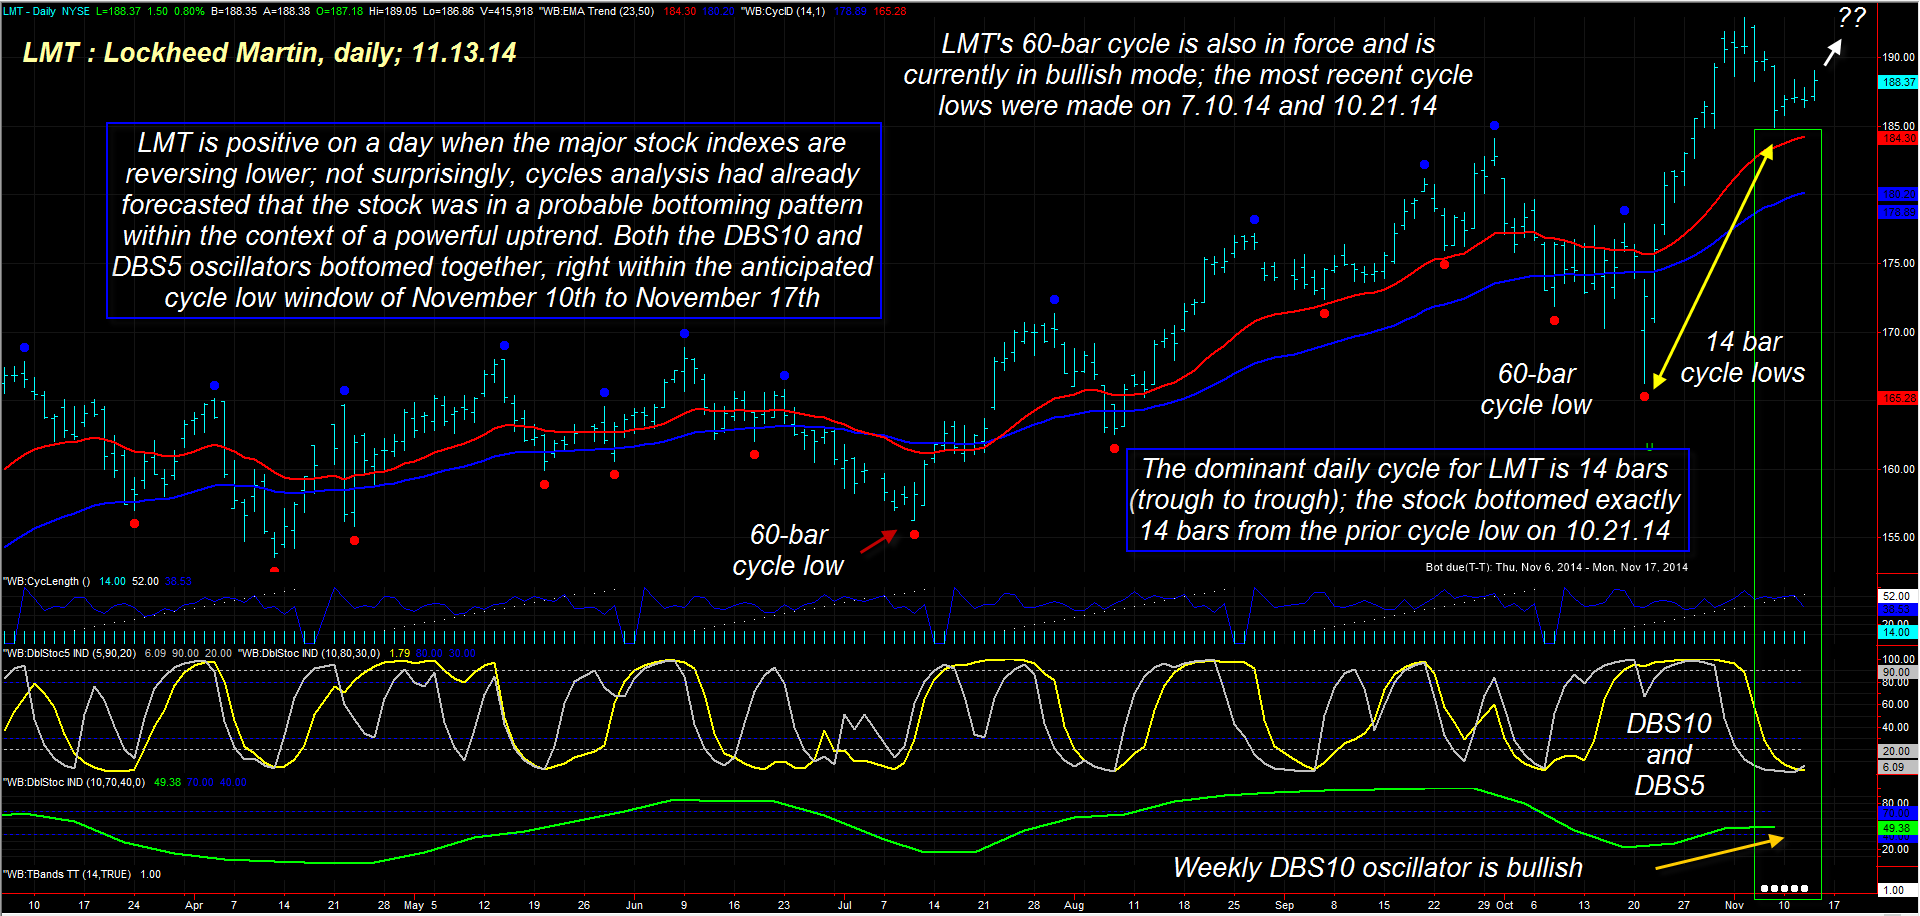
| Lockheed Martin shares (LMT) bottomed later than the major stock indexes did last month, not putting in their final low of the September/October 2014 sell-off until October 21, 2014. But the stock still rallied sharply, moving up by 16% in only 11 trading sessions, peaking at 192.94 on November 4, 2014. The stock made a proportional pullback several days later and is now rallying again; what are the primary forces driving LMT and why is the stock outperforming the S&P 100/500 indexes on such a chaotic day in the markets? Here's a closer look now. |
|
| Figure 1. Lockheed Martin (LMT): With strong bullish agreement between its 14- and 60-day price cycles, this stock has a high probability of reaching the previous swing high of 192.94 before the end of November 2014. |
| Graphic provided by: TradeStation. |
| Graphic provided by: ProfitTrader7 from www.walterbressert.com. |
| |
| The most accurate answer to the question of why a particular stock is able to perform well (long-term or even on a day to day basis) would have to include the topic of price cycles, primary trend, comparative relative strength, and earnings growth rates. Technical traders, particularly day and swing traders, need not concern themselves with fundamentals (such as earnings metrics), but all traders need to focus on the first three (technical) items mentioned. In LMT's case, the stock is in a bullish mode (Figure 1): 1. LMT's dominant price cycle (trough to trough) measures 14 price bars and is based on 10 years of historical data; the cycle is very much 'on time' lately, as its most recent swing low (November 7, 2014) was made 13 bars from the last cycle low on October 21, 2014. 2. This cycle low is confirmed by the DBS10/DBS5 oscillators, both of which have bottomed in concert. 3. The 60-bar cycle in LMT also bottomed on October 21, 2014 and is in bullish mode; it previously bottomed on July 10, 2014. 4. AS LMT pulled back into the recent low, note that it remains above the red and blue exponential moving average (EMA) lines and that the weekly DBS10 oscillator (bottom of chart) is also in bullish mode. 3. Various cycle timing tools had already forecasted that the window between November 10, 2014 and November 17, 2014 were the most likely times for this new 14-bar cycle low to be achieved. Typically, in a strong bullish phase, the pullbacks from the cycle high are relatively shallow — 38% or less — and occur within three to five bars from the high. When you see the stock begin to reverse higher as all of this occurs, the probabilities are good that a tradable swing is developing, one that 'should' move back up to meet the previous cycle high (in this case, 192.94). |
|
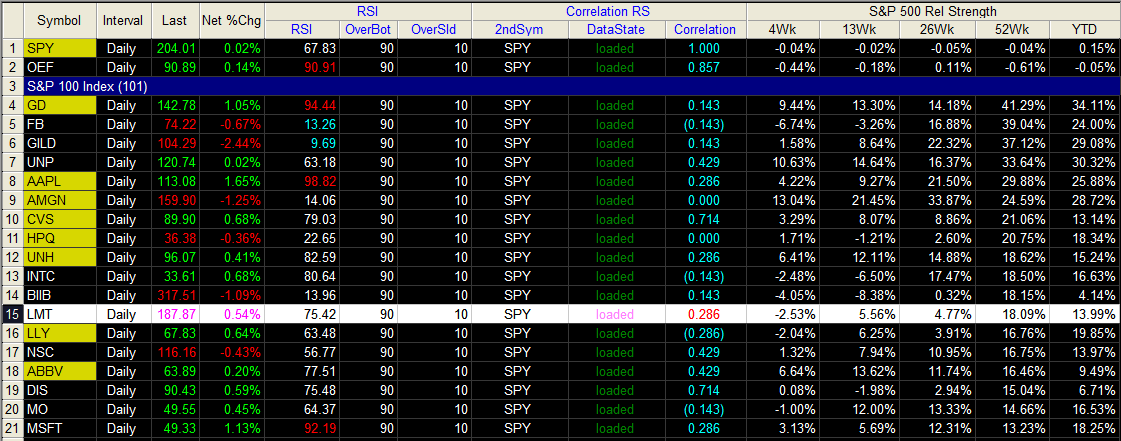
| Figure 2. Relative Performance. LMT is outperforming the S&P 500 index (.SPX, SPY) over the past 13-, 26-, and 52-week periods; it's also outperforming the index year-to-date. |
| Graphic provided by: ProfitTrader7 from www.walterbressert.com. |
| |
| LMT is not especially well-correlated to the S&P 100/500 indexes (.OEX, .SPX); the factor is only .286 over the past 14 days and .333 over the past calendar quarter, meaning that it's no surprise that the stock can and does buck the broad market trend from time to time (Figure 2). Given the powerful 14- and 60-bar cycles at work in LMT now, the odds are good for the stock to rally to at least the November 4, 2014 high of 192.94 within the next five to 10 trading sessions. The long entry point is at 187.90 and can be managed with a simple two-bar trailing stop of the daily lows. The prior swing high becomes the logical profit taking zone and the initial stop should be placed near 186.10 and this will set up a risk/reward ratio of better than 3:1 — super attractive for a swing trade setup. Keep your account risk at around 1% and remember to trade wisely until we meet here again. |
Freelance financial markets writer and online publisher of the Trendzetterz.com S&P 500 Weekly Forecast service.
| Title: | Market consultant and writer |
| Company: | Trendzetterz |
| Address: | 81 Hickory Hollow Drive |
| Crossville, TN 38555 | |
| Phone # for sales: | 904-303-4814 |
| Website: | trendzetterz.com |
| E-mail address: | support@trendzetterz.com |
Traders' Resource Links | |
| Trendzetterz has not added any product or service information to TRADERS' RESOURCE. | |
Click here for more information about our publications!
PRINT THIS ARTICLE

Request Information From Our Sponsors
- VectorVest, Inc.
- Executive Premier Workshop
- One-Day Options Course
- OptionsPro
- Retirement Income Workshop
- Sure-Fire Trading Systems (VectorVest, Inc.)
- Trading as a Business Workshop
- VectorVest 7 EOD
- VectorVest 7 RealTime/IntraDay
- VectorVest AutoTester
- VectorVest Educational Services
- VectorVest OnLine
- VectorVest Options Analyzer
- VectorVest ProGraphics v6.0
- VectorVest ProTrader 7
- VectorVest RealTime Derby Tool
- VectorVest Simulator
- VectorVest Variator
- VectorVest Watchdog
- StockCharts.com, Inc.
- Candle Patterns
- Candlestick Charting Explained
- Intermarket Technical Analysis
- John Murphy on Chart Analysis
- John Murphy's Chart Pattern Recognition
- John Murphy's Market Message
- MurphyExplainsMarketAnalysis-Intermarket Analysis
- MurphyExplainsMarketAnalysis-Visual Analysis
- StockCharts.com
- Technical Analysis of the Financial Markets
- The Visual Investor