HOT TOPICS LIST
- MACD
- Fibonacci
- RSI
- Gann
- ADXR
- Stochastics
- Volume
- Triangles
- Futures
- Cycles
- Volatility
- ZIGZAG
- MESA
- Retracement
- Aroon
INDICATORS LIST
LIST OF TOPICS
PRINT THIS ARTICLE
by Koos van der Merwe
The shares of Facebook are up 38% year-to-date compared to the S&P 500's gain of 10%.
Position: Accumulate
Koos van der Merwe
Has been a technical analyst since 1969, and has worked as a futures and options trader with First Financial Futures in Johannesburg, South Africa.
PRINT THIS ARTICLE
ELLIOTT WAVE
Another Look At Facebook
11/17/14 04:49:01 PMby Koos van der Merwe
The shares of Facebook are up 38% year-to-date compared to the S&P 500's gain of 10%.
Position: Accumulate
| Are the shares of Facebook (FB) a buy at present levels? Has Mark Zuckerberg got something up his sleeve that the market is not aware of or has the company peaked, with nothing new that will boost its share price? |

|
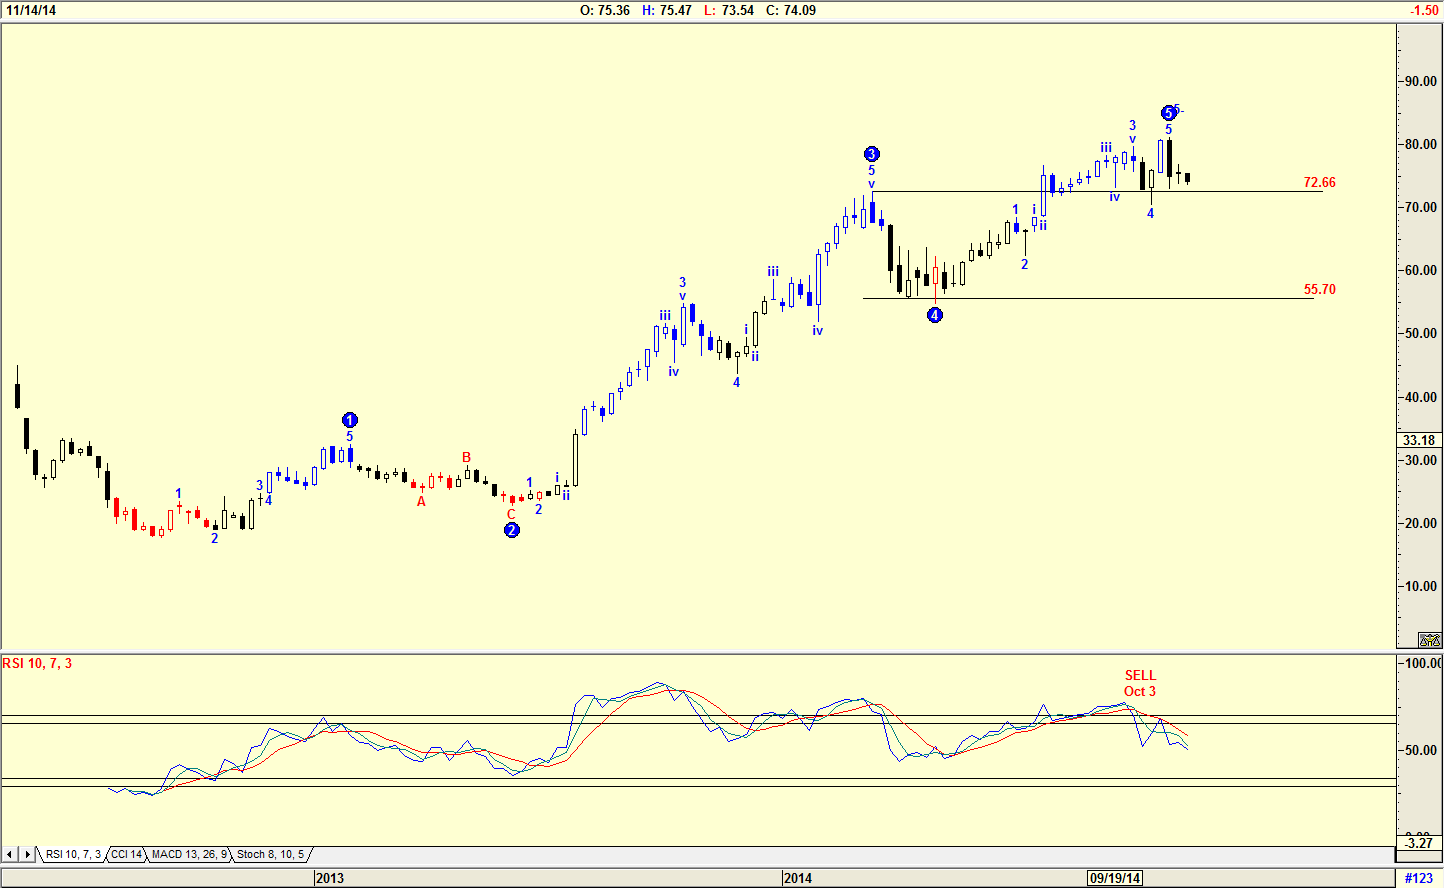
| Figure 1. Weekly Chart With Elliott Wave Count. The price of Facebook (FB) stock has completed a WAVE 5 and is due to fall in an ABC correction. |
| Graphic provided by: AdvancedGET. |
| |
| The chart in Figure 1 is a weekly chart with an Elliott Wave count suggesting that the share price of FB has completed a WAVE 5 and is now due to fall in an ABC correction. The chart is suggesting that the share price could fall to somewhere between $55.70 to $72.66, the 4th wave of lesser degree. This correction is confirmed by the Relative Strength Index (RSI) which gave a sell signal on October 3, 2014. |

|
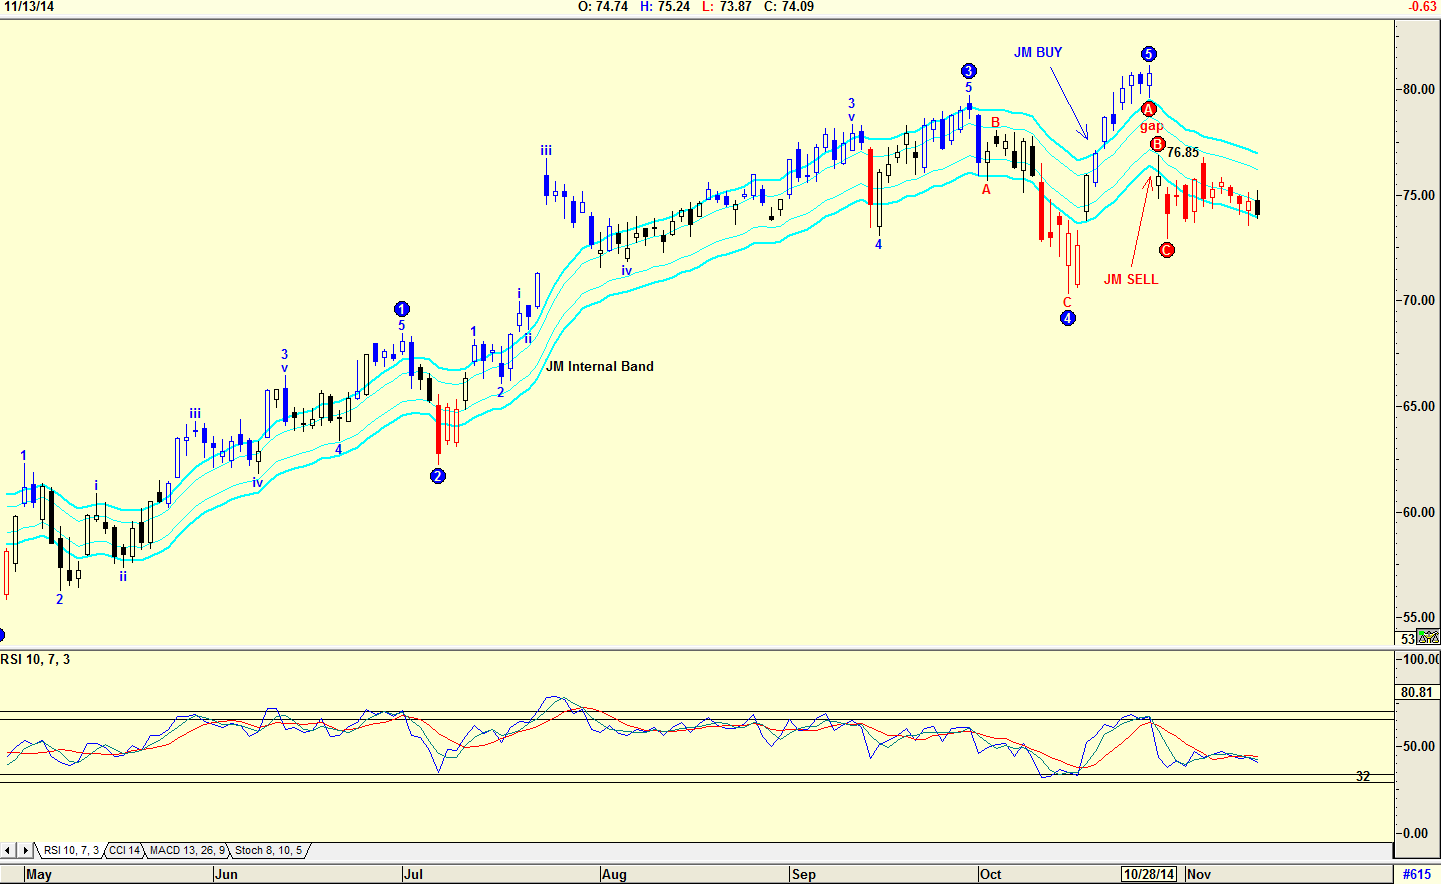
| Figure 2. Gaps. The Elliott Wave count on the daily chart confirms what is seen in the weekly chart. |
| Graphic provided by: AdvancedGET. |
| |
| The chart in Figure 2 is a daily chart, with an Elliott Wave count similar to the weekly chart in that the Elliott Wave count has confirmed the completion of WAVE 5. The chart is suggesting that the ABC correction is complete, and with the gap shown on the chart, the suggestion is that the share should rise to above $76.95 to 'fill the gap'. Note the JM Internal Band. A JM Internal Band is a 15-period simple moving average offset by 2% positive and 2% negative. A move above the upper band suggests a buy and a mover below the lower band, a sell. The RSI is still suggesting weakness, and will only suggest a buy when it falls below and then rises above the 32 horizontal line. However, note that the candlestick pattern has changed color from red to black, suggesting that the share price is no longer negative, but neutral. The Expert Trend Locator, as the change in color is known, is a study developed by Advanced GET that uses a statistical evaluation of the market. The strategy was designed to tell the difference between random market swings (noise) and directed market swings (trends). If the bars are blue then the trend is up. If the bars are red, then the trend is down. A black bar suggests a change of trend is possibly in the offing. With the market expected to rise into December before traders start selling shares that are showing a loss for tax purposes, buying shares in FB could be a risk worth buying for the short-term. |
Has been a technical analyst since 1969, and has worked as a futures and options trader with First Financial Futures in Johannesburg, South Africa.
| Address: | 3256 West 24th Ave |
| Vancouver, BC | |
| Phone # for sales: | 6042634214 |
| E-mail address: | petroosp@gmail.com |
Click here for more information about our publications!
Comments
Date: 11/18/14Rank: 2Comment:

Request Information From Our Sponsors
- StockCharts.com, Inc.
- Candle Patterns
- Candlestick Charting Explained
- Intermarket Technical Analysis
- John Murphy on Chart Analysis
- John Murphy's Chart Pattern Recognition
- John Murphy's Market Message
- MurphyExplainsMarketAnalysis-Intermarket Analysis
- MurphyExplainsMarketAnalysis-Visual Analysis
- StockCharts.com
- Technical Analysis of the Financial Markets
- The Visual Investor
- VectorVest, Inc.
- Executive Premier Workshop
- One-Day Options Course
- OptionsPro
- Retirement Income Workshop
- Sure-Fire Trading Systems (VectorVest, Inc.)
- Trading as a Business Workshop
- VectorVest 7 EOD
- VectorVest 7 RealTime/IntraDay
- VectorVest AutoTester
- VectorVest Educational Services
- VectorVest OnLine
- VectorVest Options Analyzer
- VectorVest ProGraphics v6.0
- VectorVest ProTrader 7
- VectorVest RealTime Derby Tool
- VectorVest Simulator
- VectorVest Variator
- VectorVest Watchdog
