HOT TOPICS LIST
- MACD
- Fibonacci
- RSI
- Gann
- ADXR
- Stochastics
- Volume
- Triangles
- Futures
- Cycles
- Volatility
- ZIGZAG
- MESA
- Retracement
- Aroon
INDICATORS LIST
LIST OF TOPICS
PRINT THIS ARTICLE
by Gary Grosschadl
Movement in the $USD often serves as a strong clue for upcoming direction for the main indices.
Position: N/A
Gary Grosschadl
Independent Canadian equities trader and technical analyst based in Peterborough
Ontario, Canada.
PRINT THIS ARTICLE
CHART ANALYSIS
Is US Dollar Tipping Market Direction?
11/01/02 11:01:49 AMby Gary Grosschadl
Movement in the $USD often serves as a strong clue for upcoming direction for the main indices.
Position: N/A
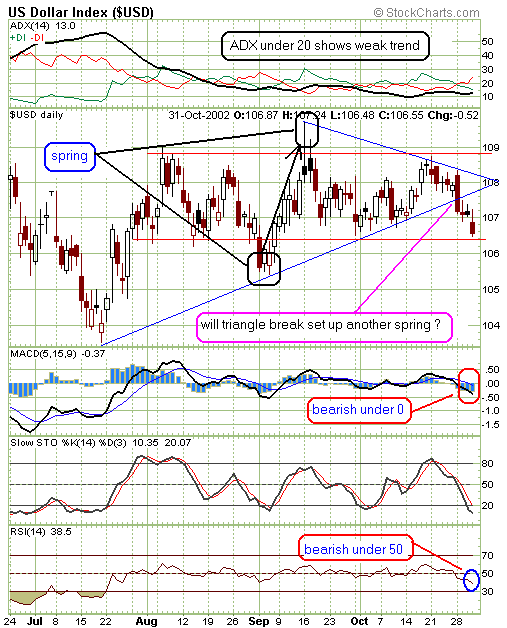
| When I have difficulty in deciphering where the Dow/Nasdaq might be going in the short term, I often check on the $USD. The last time I wrote about the $USD tipping the market's direction it was accurate and timely. Now it seems to be making a downside move as the main indices move sideways, perhaps acting as another harbinger of things to come. |
| The daily chart shows some interesting points. The $USD has been in a sideways channel for several months but now has weakened into a triangle downside break. This could signal that the lower channel might be breached again, as opposed to another bounce up. This extra bearishness could coincide with the main indices heading down. |

|
| Graphic provided by: stockcharts.com. |
| |
| The displayed indicators are sending somewhat mixed messages. The ADX shows weak directional strength and stochastics are in oversold territory which suggests that the $USD could turn up any time. However the MACD and RSI indicators are still bearish and have room to fall suggesting more downside play is possible. |
| Also on the chart is a prior "spring" effect. A spring occurs when an unsustained higher or lower movement is made outside the current channel. The result is a slingshot move to a similar piercing of the channel on the opposite extreme. |
| Traders should watch if this triangle break does lead to a breach below the channel. If so, this may set up another spring. Also, is this negative action in the $USD setting up the main indices for failure just around the corner? |
Independent Canadian equities trader and technical analyst based in Peterborough
Ontario, Canada.
| Website: | www.whatsonsale.ca/financial.html |
| E-mail address: | gwg7@sympatico.ca |
Click here for more information about our publications!
Comments
Date: 11/02/02Rank: 4Comment: When will USD start going up Gary and how 1 how much will it move upwards on a daily basis average.Kindly mail me at chattdhruva@yahoo.com if you can.would be obliged.
Date: 11/02/02Rank: 5Comment:
Date: 11/03/02Rank: 5Comment: Yes I agree, it would appear the dollar has broken down to the downside signaling possible further falls. Looking at the $VIX now dropping through 35 points for the first time since mid August and passing through its 50 day SMA, I believe this is a further indicator of another fall to come shortly.
Date: 11/05/02Rank: Comment: I ve been thinking about the same for sometime now and noticed back in last July how the dollr turned up from its lows 3 days before the Dow. This time round it seems that the market is factoring a cut in interest rates from the Fed of around 50 basis points and that would be bearish for the dollar while perversely supportive for stocks in the current mood. Would the Fed do nothing this week we might see a bounce in the dollar.
Date: 11/05/02Rank: 5Comment:
Date: 11/06/02Rank: 4Comment:
Date: 11/17/02Rank: 3Comment: Would have been better without all the nonsense indicators.

Request Information From Our Sponsors
- StockCharts.com, Inc.
- Candle Patterns
- Candlestick Charting Explained
- Intermarket Technical Analysis
- John Murphy on Chart Analysis
- John Murphy's Chart Pattern Recognition
- John Murphy's Market Message
- MurphyExplainsMarketAnalysis-Intermarket Analysis
- MurphyExplainsMarketAnalysis-Visual Analysis
- StockCharts.com
- Technical Analysis of the Financial Markets
- The Visual Investor
- VectorVest, Inc.
- Executive Premier Workshop
- One-Day Options Course
- OptionsPro
- Retirement Income Workshop
- Sure-Fire Trading Systems (VectorVest, Inc.)
- Trading as a Business Workshop
- VectorVest 7 EOD
- VectorVest 7 RealTime/IntraDay
- VectorVest AutoTester
- VectorVest Educational Services
- VectorVest OnLine
- VectorVest Options Analyzer
- VectorVest ProGraphics v6.0
- VectorVest ProTrader 7
- VectorVest RealTime Derby Tool
- VectorVest Simulator
- VectorVest Variator
- VectorVest Watchdog
