HOT TOPICS LIST
- MACD
- Fibonacci
- RSI
- Gann
- ADXR
- Stochastics
- Volume
- Triangles
- Futures
- Cycles
- Volatility
- ZIGZAG
- MESA
- Retracement
- Aroon
INDICATORS LIST
LIST OF TOPICS
PRINT THIS ARTICLE
by Donald W. Pendergast, Jr.
Shares of Chubb Corp. are trading above what normally proves to be a high probability exhaustion level.
Position: N/A
Donald W. Pendergast, Jr.
Freelance financial markets writer and online publisher of the Trendzetterz.com S&P 500 Weekly Forecast service.
PRINT THIS ARTICLE
KELTNER CHANNELS
Chubb: Statistically Overextended
11/14/14 06:33:16 PMby Donald W. Pendergast, Jr.
Shares of Chubb Corp. are trading above what normally proves to be a high probability exhaustion level.
Position: N/A
| Insurance industry group stocks enjoyed a nice rally over the past four weeks and one of the legacy issues within this group — Chubb Corp. (CB) — also rose by a substantial amount, up by nearly 13% in just 20 trading sessions. But as is the case with many S&P 500 index (.SPX) components, CB has actually pierced above an important trend exhaustion resistance level, a surge that always leads to a proportional correction soon afterward. Here's a closer look now. |

|
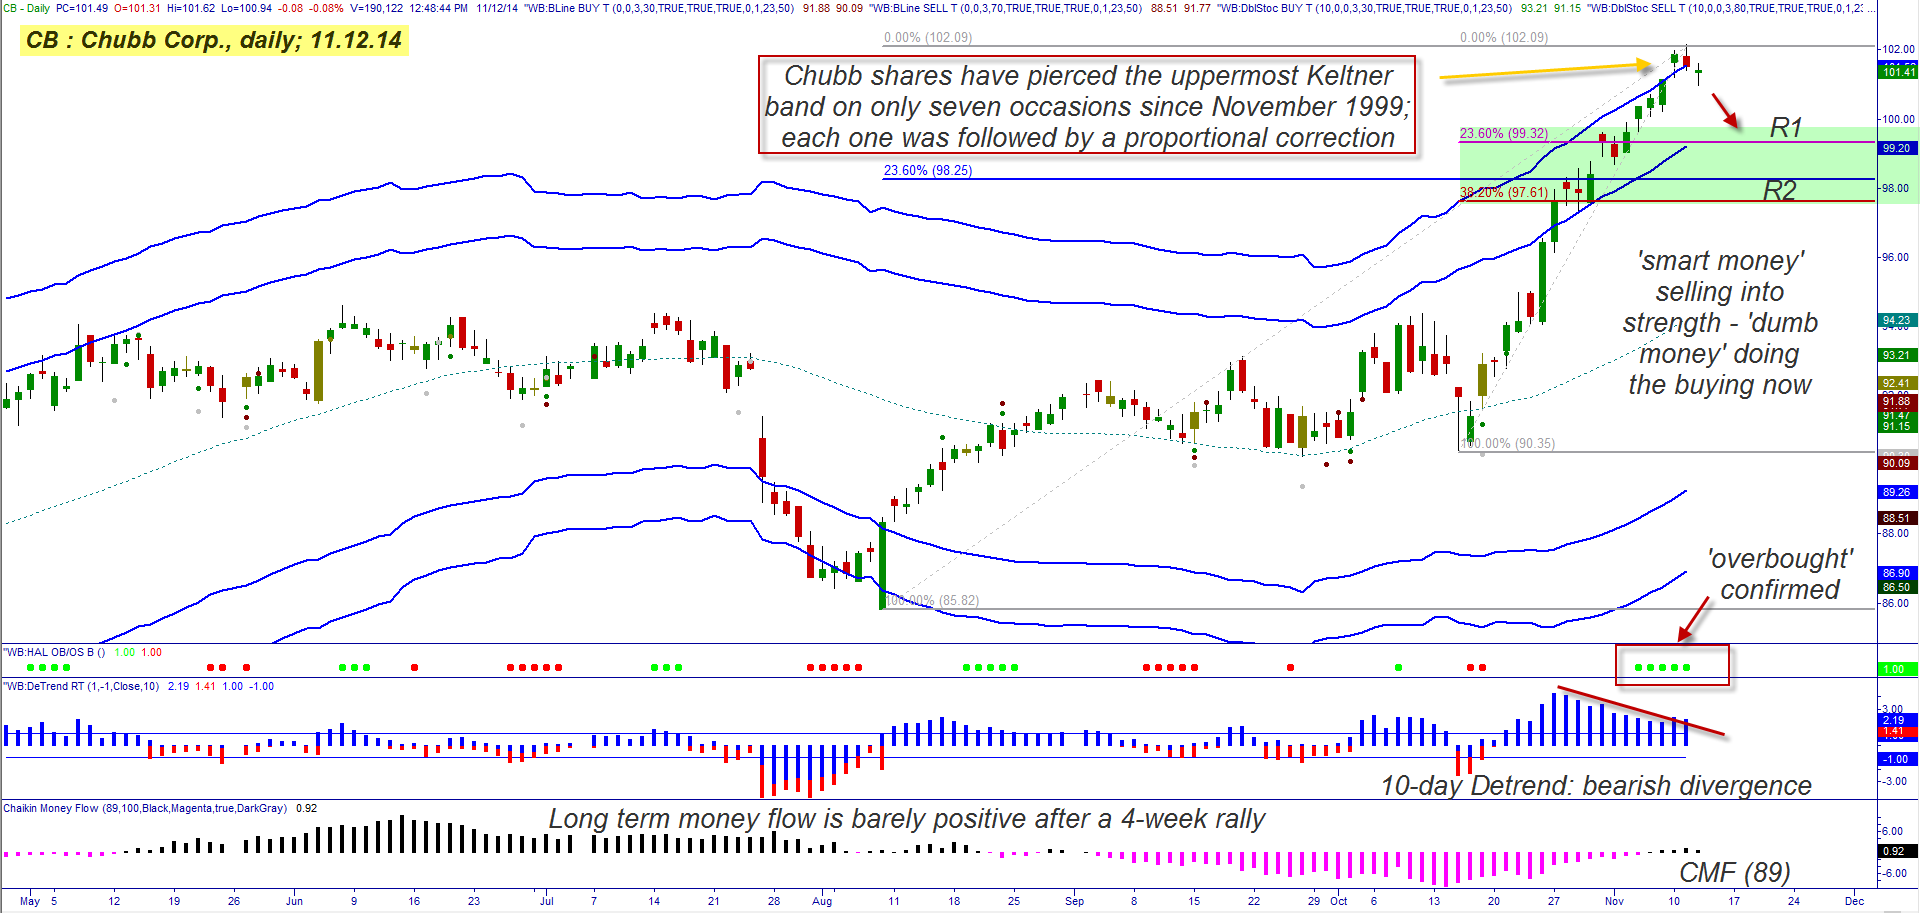
| Figure 1. Chubb Corp. (CB): This stock appears to be at the exhaustion point of the entire rally that launched in early August 2014. |
| Graphic provided by: TradeStation. |
| Graphic provided by: ProfitTrader 7 from www.walterbressert.com. |
| |
| CB's month long rally out of the October 15, 2014 crater had begun to assume some of the characteristics of an unsustainable parabolic rise by the time it hit its extreme upper Keltner band on Friday, November 7, 2014 (Figure 1); Chubb has only pierced and/or exceeded that top band seven times since October 1999, always correcting lower not long after. This same dynamic repeats over and over in most liquid stocks and futures markets and is a valuable trend exhaustion warning tool, especially when combined with several other technical indicators such as 1. Long-term money flow 2. Price cycles 3. Detrend oscillator 4. Overbought indicators In Chubb's case, an astute technician would note that as the stock climbed past 97.95 that the detrend histogram began to make lower highs — warning of a loss of upside momentum and that the half-cycle high had been achieved. At the same time, the 89-day Chaikin Money Flow histogram (CMF)(89) (bottom of chart) still had not moved into bullish territory; this was a sign that the "smart money" were using the rally as a cover to distribute their shares to latecomers (the "dumb money"). In fact the histogram only went positive three days before the high of 102.15 was reached. Next, the green HAL overbought dots began to print, providing even more confirmation that the move was getting overripe for a pullback. |

|
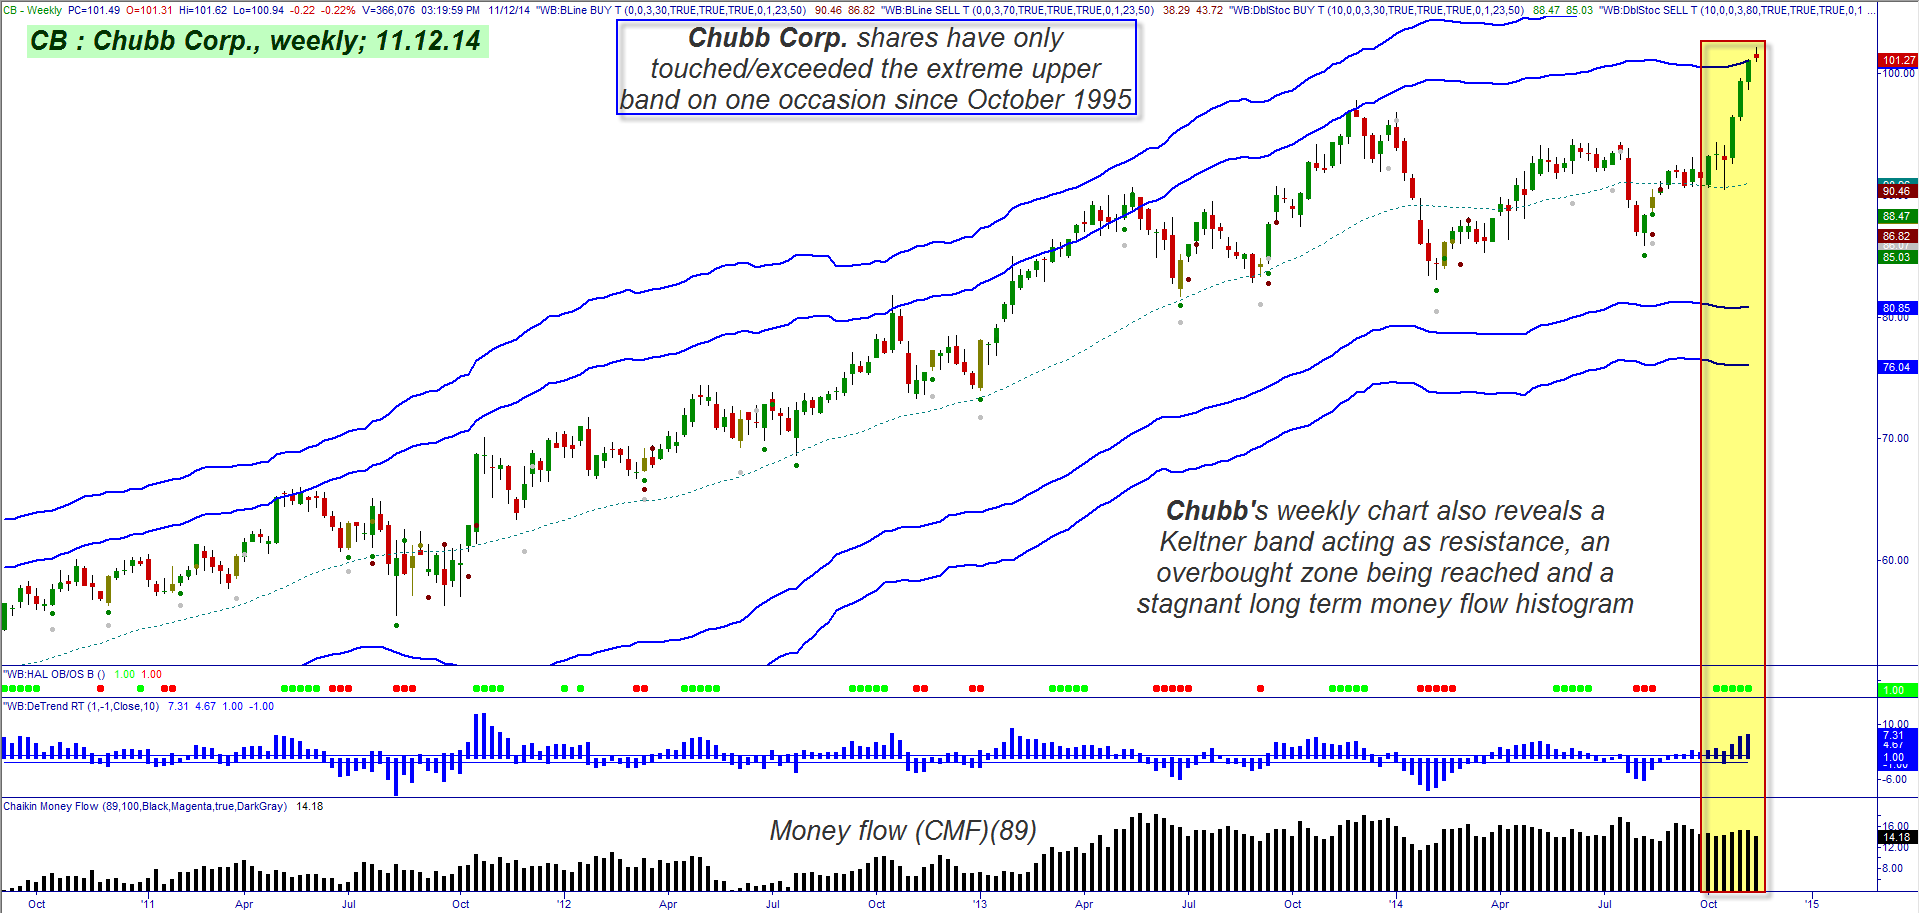
| Figure 2. A Resistance Level? CB has also reached an important resistance level on its weekly chart; note that the stock has only reached/exceeded its upper Keltner band on one occasion in the past 20 years. |
| Graphic provided by: TradeStation. |
| Graphic provided by: ProfitTrader 7 from www.walterbressert.com. |
| |
| All of the ingredients do indeed warn of a high probability pullback into a near-term cycle low in the days just ahead — in fact, the green shaded area (97.61 to 99.32) highlights the general area in which CB should find a new infusion of buying interest. However, longer-term, CB has powerful bullish weekly (Figure 2) and monthly cycles hard at work, and that could mean even higher prices to come, once the anticipated daily time frame correction to R1/R2 occurs over the next few weeks. But be aware that the weekly and monthly charts also reveal CB to be at nominal resistance levels; bulls definitely need to wait for a meaningful daily chart correction before considering going long CB again. Existing longs need to be considering their exit/profit taking strategy; they can use a trend line break, volatility trailing stop violation, or even a two to three bar daily trailing stop to assist in this process. CB has a regular 22-bar cycle on its daily chart, but at the moment it's the 60-day cycle exerting major control over the stock; as CB is now 63 bars into that cycle, look for this equity to begin rolling over in search of meaningful (R1/R2) support. Be patient and you may be rewarded with an attractive buying opportunity once the correction plays out. Trade wisely until we meet here again. |
Freelance financial markets writer and online publisher of the Trendzetterz.com S&P 500 Weekly Forecast service.
| Title: | Market consultant and writer |
| Company: | Trendzetterz |
| Address: | 81 Hickory Hollow Drive |
| Crossville, TN 38555 | |
| Phone # for sales: | 904-303-4814 |
| Website: | trendzetterz.com |
| E-mail address: | support@trendzetterz.com |
Traders' Resource Links | |
| Trendzetterz has not added any product or service information to TRADERS' RESOURCE. | |
Click here for more information about our publications!
Comments

Request Information From Our Sponsors
- StockCharts.com, Inc.
- Candle Patterns
- Candlestick Charting Explained
- Intermarket Technical Analysis
- John Murphy on Chart Analysis
- John Murphy's Chart Pattern Recognition
- John Murphy's Market Message
- MurphyExplainsMarketAnalysis-Intermarket Analysis
- MurphyExplainsMarketAnalysis-Visual Analysis
- StockCharts.com
- Technical Analysis of the Financial Markets
- The Visual Investor
- VectorVest, Inc.
- Executive Premier Workshop
- One-Day Options Course
- OptionsPro
- Retirement Income Workshop
- Sure-Fire Trading Systems (VectorVest, Inc.)
- Trading as a Business Workshop
- VectorVest 7 EOD
- VectorVest 7 RealTime/IntraDay
- VectorVest AutoTester
- VectorVest Educational Services
- VectorVest OnLine
- VectorVest Options Analyzer
- VectorVest ProGraphics v6.0
- VectorVest ProTrader 7
- VectorVest RealTime Derby Tool
- VectorVest Simulator
- VectorVest Variator
- VectorVest Watchdog
