HOT TOPICS LIST
- MACD
- Fibonacci
- RSI
- Gann
- ADXR
- Stochastics
- Volume
- Triangles
- Futures
- Cycles
- Volatility
- ZIGZAG
- MESA
- Retracement
- Aroon
INDICATORS LIST
LIST OF TOPICS
PRINT THIS ARTICLE
by Koos van der Merwe
Here's one company that could take the US markets by storm.
Position: Buy
Koos van der Merwe
Has been a technical analyst since 1969, and has worked as a futures and options trader with First Financial Futures in Johannesburg, South Africa.
PRINT THIS ARTICLE
TECHNICAL ANALYSIS
Taking A Chance With Another Company Based In China
11/14/14 06:28:04 PMby Koos van der Merwe
Here's one company that could take the US markets by storm.
Position: Buy
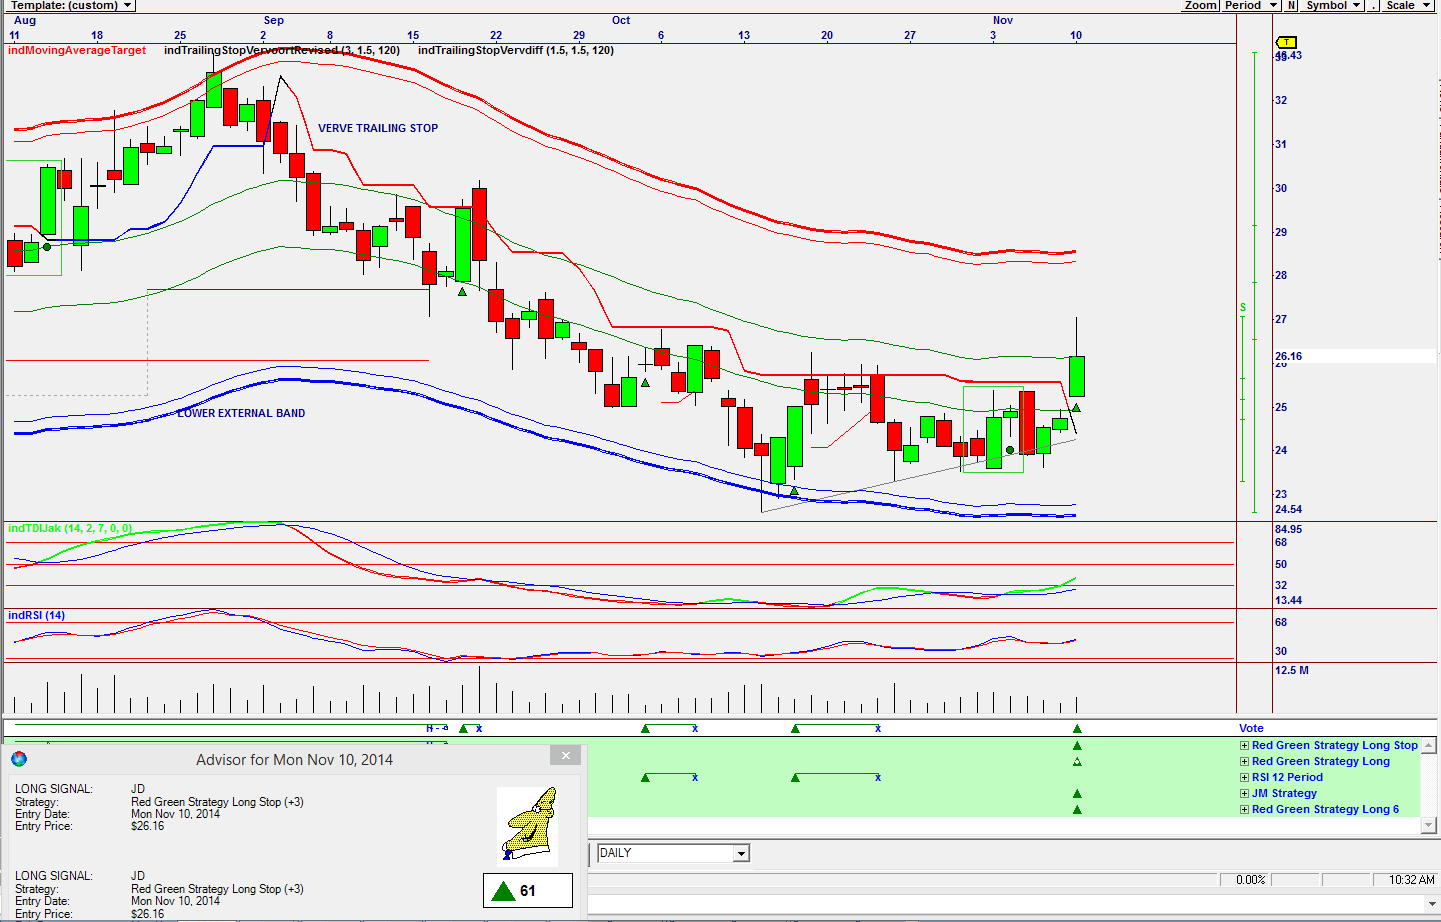
| Alibaba (BABA), a Chinese company, is winning strongly on the US stock market. Is it time to look at other companies from China that are listed on the US stock exchange as a solid investment? On October 31, 2014, JD Com, Inc. announced that it plans to release its unaudited third quarter 2014 financial results on November 17, 2014, before the market opens. Looking at a chart, do you take the risk and buy the share before the financial results are announced? |

|
| Figure 1. To Buy Or To Buy? On this daily chart of JD are four strategies that are suggesting a buy. |
| Graphic provided by: Omnitrader. |
| |
| The chart in Figure 1 is a daily chart suggesting a buy based on four strategies shown below the Vote line. The chart also shows two indicators, the INDJAK indicator and the 14-period relative strength index (RSI), and both are in a buy mode. The Advisor rating shown on the chart is 61, which is a good rating. |

|
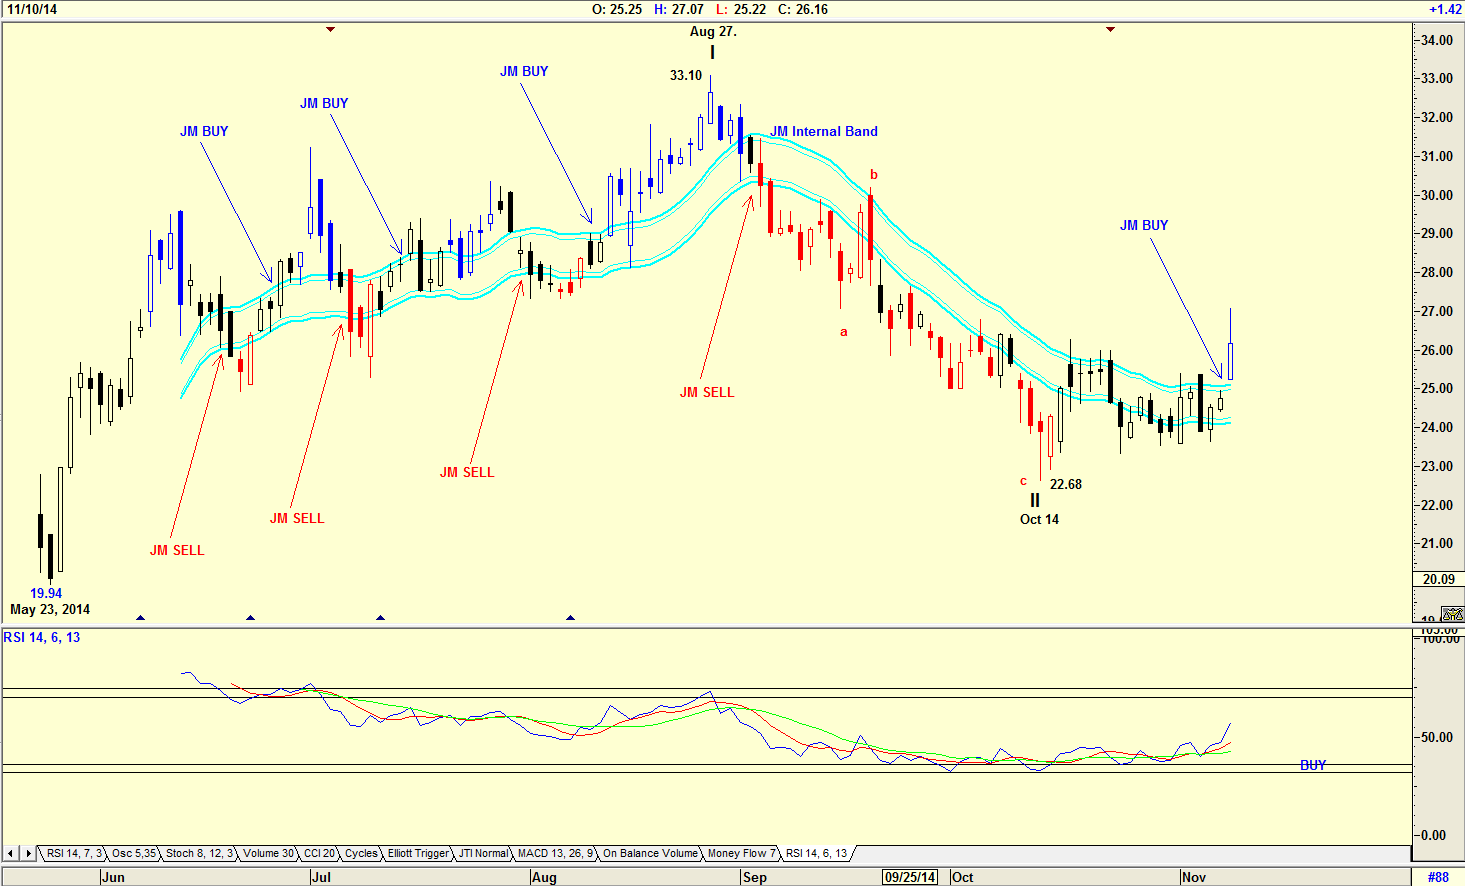
| Figure 2. Looking For Confirmation. On this daily chart you see how the share price rose , fell, and then started moving up again. All signs still point to a move up, at the moment. |
| Graphic provided by: AdvancedGET. |
| |
| The chart in Figure 2 is a daily chart showing how the share price rose with uncertainty in an Elliott Wave count from $19.94 on May 23, 2014 to $33.10 by August 27, 2014. The share price then fell to $22.68 by October 14, 2014 and started to move up as the RSI reached oversold levels and struggled to give a buy signal. The Elliott Wave count suggested that the share price has completed a WAVE I and WAVE II. This count is purely speculative and could change as the share price moves down the road. You should never forget that an Elliott Wave count is purely a signpost in the wilderness and could change at any time as the share prices changes its pattern. However, the share price has given a JM Internal Band buy, suggesting strength. The JM Internal Band is a 15-period simple moving average offset by 2% positive and 2% negative. A move above the upper band suggests a buy, and a move below the lower band a sell. I have always preferred to purchase a share when it moves into an Elliott Wave III, because a wave three is normally equal to or greater than a wave one. With WAVE I equal to $13.16 (33.10-19.94=13.16) I expect WAVE III to rise to $35.84 or greater (22.68+13.16=35.84). With the chart in Figure 1 suggesting a buy, and with the JM Internal Band suggesting a buy, and finally — if the Elliott Wave count is correct — I would be a buyer of the share. |
Has been a technical analyst since 1969, and has worked as a futures and options trader with First Financial Futures in Johannesburg, South Africa.
| Address: | 3256 West 24th Ave |
| Vancouver, BC | |
| Phone # for sales: | 6042634214 |
| E-mail address: | petroosp@gmail.com |
Click here for more information about our publications!
Comments

|

Request Information From Our Sponsors
- StockCharts.com, Inc.
- Candle Patterns
- Candlestick Charting Explained
- Intermarket Technical Analysis
- John Murphy on Chart Analysis
- John Murphy's Chart Pattern Recognition
- John Murphy's Market Message
- MurphyExplainsMarketAnalysis-Intermarket Analysis
- MurphyExplainsMarketAnalysis-Visual Analysis
- StockCharts.com
- Technical Analysis of the Financial Markets
- The Visual Investor
- VectorVest, Inc.
- Executive Premier Workshop
- One-Day Options Course
- OptionsPro
- Retirement Income Workshop
- Sure-Fire Trading Systems (VectorVest, Inc.)
- Trading as a Business Workshop
- VectorVest 7 EOD
- VectorVest 7 RealTime/IntraDay
- VectorVest AutoTester
- VectorVest Educational Services
- VectorVest OnLine
- VectorVest Options Analyzer
- VectorVest ProGraphics v6.0
- VectorVest ProTrader 7
- VectorVest RealTime Derby Tool
- VectorVest Simulator
- VectorVest Variator
- VectorVest Watchdog
