

HOT TOPICS LIST
- MACD
- Fibonacci
- RSI
- Gann
- ADXR
- Stochastics
- Volume
- Triangles
- Futures
- Cycles
- Volatility
- ZIGZAG
- MESA
- Retracement
- Aroon
INDICATORS LIST
LIST OF TOPICS
PRINT THIS ARTICLE
by Donald W. Pendergast, Jr.
Up by 23% in the past four weeks, shares of O'Reilly Automotive, Inc. are at a key cycle high.
Position: N/A
Donald W. Pendergast, Jr.
Freelance financial markets writer and online publisher of the Trendzetterz.com S&P 500 Weekly Forecast service.
PRINT THIS ARTICLE
CYCLES
ORLY: Divergences Near Cycle High
11/12/14 03:32:19 PMby Donald W. Pendergast, Jr.
Up by 23% in the past four weeks, shares of O'Reilly Automotive, Inc. are at a key cycle high.
Position: N/A
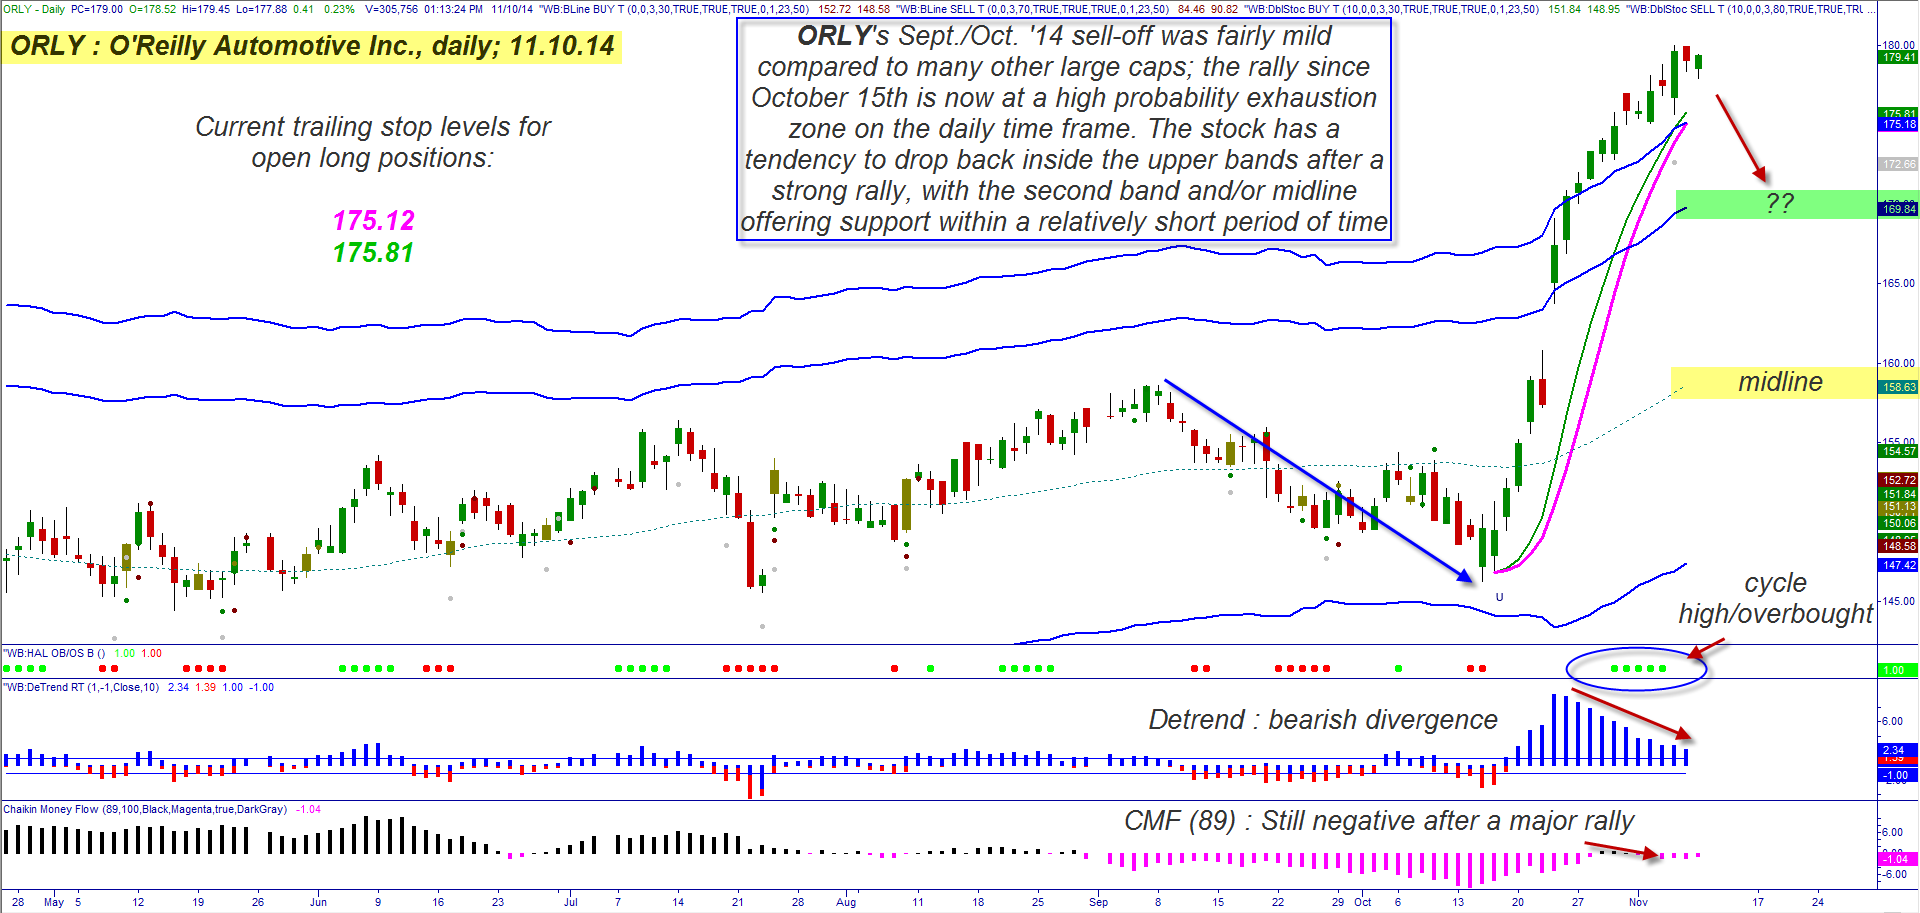
| Compared to some other large cap names in the S&P 500 index (.SPX, SPY), shares of O'Reilly Automotive Inc. (ORLY) experienced only a modest sell-off in September/October 2014; given such comparative relative strength against the broad market, it's therefore not surprising to see that the stock has not only outperformed the .SPX on the rebound but has also gone on to make new all-time highs as well. But even the strongest rallies need to pause and or/correct before moving higher. Here's a closer look at a high probability near-term bearish reversal that is setting up on ORLY's daily chart now (Figure 1). |
|
| Figure 1. Bearish Reversal. O'Reilly Automotive Inc. (ORLY) has a long history of pulling back to the lower topmost Keltner band (green shaded area) after a long rally; deeper corrections are usually halted by the Keltner midline (yellow shaded area). |
| Graphic provided by: TradeStation. |
| Graphic provided by: ProfitTrader7 from www.walterbressert.com. |
| |
| Viewing the various technicals on ORLY's daily time frame, the following is evident: 1. The stock has powerful upside momentum, with a 10-day ADX reading of 64.47 2. It has pierced above the top two Keltner bands; over the past 15 years, ORLY has only traded above the topmost band on several occasions, never closing above it for more than seven trading sessions. 3. The green dots indicate that a high probability overbought zone has been reached. 4. Both trailing stops (green and magenta) confirm a powerful uptrend, but the stock is getting much closer to the end of this particular bullish cycle. 5. The 10-day detrend oscillator is also suggesting the move is over. 6. The 89-day Chaikin Money Flow histogram (CMF)(89) is still in negative territory, even after such a massive rally 7. ORLY's weekly chart (not shown) is also manifesting significant money flow and detrend divergences with price action; the stock is also nearing the uppernost weekly chart Keltner band, too. |
|
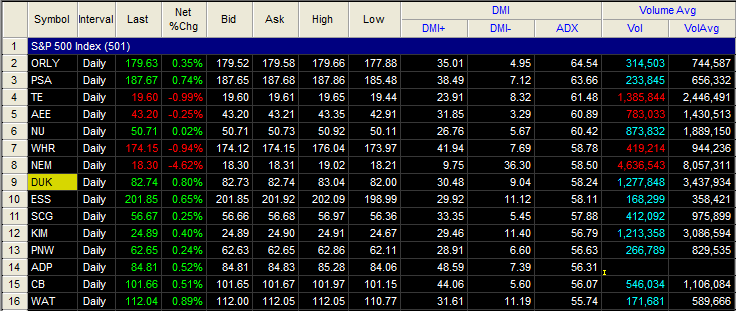
| Figure 2. Relative Performance. ORLY has a super-high 10-day ADX reading of 64.54; yet another sign of an unsustainable rally. |
| Graphic provided by: TradeStation. |
| Graphic provided by: TradeStation 9.1 RadarScreen. |
| |
| Taken as a whole, these daily/weekly technicals strongly suggest that ORLY is at or near a high probability turning point, one that could take the stock lower for six to 10 trading sessions before the next daily cycle low offers support. A powerful, recurring technical pattern in ORLY occurs time after time when it trades above the topmost band for several sessions: a. Within seven to 10 trading sessions, ORLY will typically drop to the second top band; in this case that would be near $170.00. b. If the second top band fails to offer support, the stock will then typically drop to test the Keltner midline (thin dashed line) within one month; the midline is currently near 159.00. Be aware that all of the Keltner bands and midline have an upward slope, so the eventual support levels will be somewhat higher, should ORLY correct lower as anticipated. Although these are in and of themselves high probability trade patterns, you'll still need a technical signal to get you into and out of such trades, along with a trailing stop and/or common sense profit targets; if you're an experienced short seller, however, this should be a relatively easy process. For existing longs in ORLY, the rise above the top Keltner bands is your best 'early warning' exit signal available; if you're stubborn, however and still believe the stock can go higher here before a correction (which is possible), the two trailing stops also offer a no-nonsense, objective way to make a graceful exit and go back to cash. The trend trail is at 172.12 and the long-term trail is at 175.81; both are still rising at the moment. The weekly cycles and trend in ORLY are still bullish, but the daily chart is clearly warning that this stock should pause and move lower to digest recent gains, after which a continued rally becomes more probable. Trade wisely until we meet here again. |
Freelance financial markets writer and online publisher of the Trendzetterz.com S&P 500 Weekly Forecast service.
| Title: | Market consultant and writer |
| Company: | Trendzetterz |
| Address: | 81 Hickory Hollow Drive |
| Crossville, TN 38555 | |
| Phone # for sales: | 904-303-4814 |
| Website: | trendzetterz.com |
| E-mail address: | support@trendzetterz.com |
Traders' Resource Links | |
| Trendzetterz has not added any product or service information to TRADERS' RESOURCE. | |
Click here for more information about our publications!
PRINT THIS ARTICLE

Request Information From Our Sponsors
- StockCharts.com, Inc.
- Candle Patterns
- Candlestick Charting Explained
- Intermarket Technical Analysis
- John Murphy on Chart Analysis
- John Murphy's Chart Pattern Recognition
- John Murphy's Market Message
- MurphyExplainsMarketAnalysis-Intermarket Analysis
- MurphyExplainsMarketAnalysis-Visual Analysis
- StockCharts.com
- Technical Analysis of the Financial Markets
- The Visual Investor
- VectorVest, Inc.
- Executive Premier Workshop
- One-Day Options Course
- OptionsPro
- Retirement Income Workshop
- Sure-Fire Trading Systems (VectorVest, Inc.)
- Trading as a Business Workshop
- VectorVest 7 EOD
- VectorVest 7 RealTime/IntraDay
- VectorVest AutoTester
- VectorVest Educational Services
- VectorVest OnLine
- VectorVest Options Analyzer
- VectorVest ProGraphics v6.0
- VectorVest ProTrader 7
- VectorVest RealTime Derby Tool
- VectorVest Simulator
- VectorVest Variator
- VectorVest Watchdog