HOT TOPICS LIST
- MACD
- Fibonacci
- RSI
- Gann
- ADXR
- Stochastics
- Volume
- Triangles
- Futures
- Cycles
- Volatility
- ZIGZAG
- MESA
- Retracement
- Aroon
INDICATORS LIST
LIST OF TOPICS
PRINT THIS ARTICLE
by Koos van der Merwe
Here are four Canadian banks to look at.
Position: Buy
Koos van der Merwe
Has been a technical analyst since 1969, and has worked as a futures and options trader with First Financial Futures in Johannesburg, South Africa.
PRINT THIS ARTICLE
ELLIOTT WAVE
Canadian Banks
11/11/14 12:52:35 PMby Koos van der Merwe
Here are four Canadian banks to look at.
Position: Buy
| Banks in Canada were not affected by the mortgage crisis to the extent the banks in the USA were. Yes, the banks did fall in share price along with the collapse in the US indexes from October 2007 and although some of the banks did fall percentage wise as far as the US banks, they recovered a great deal quicker. Are they a solid investment now? Let us see what the charts say. |

|
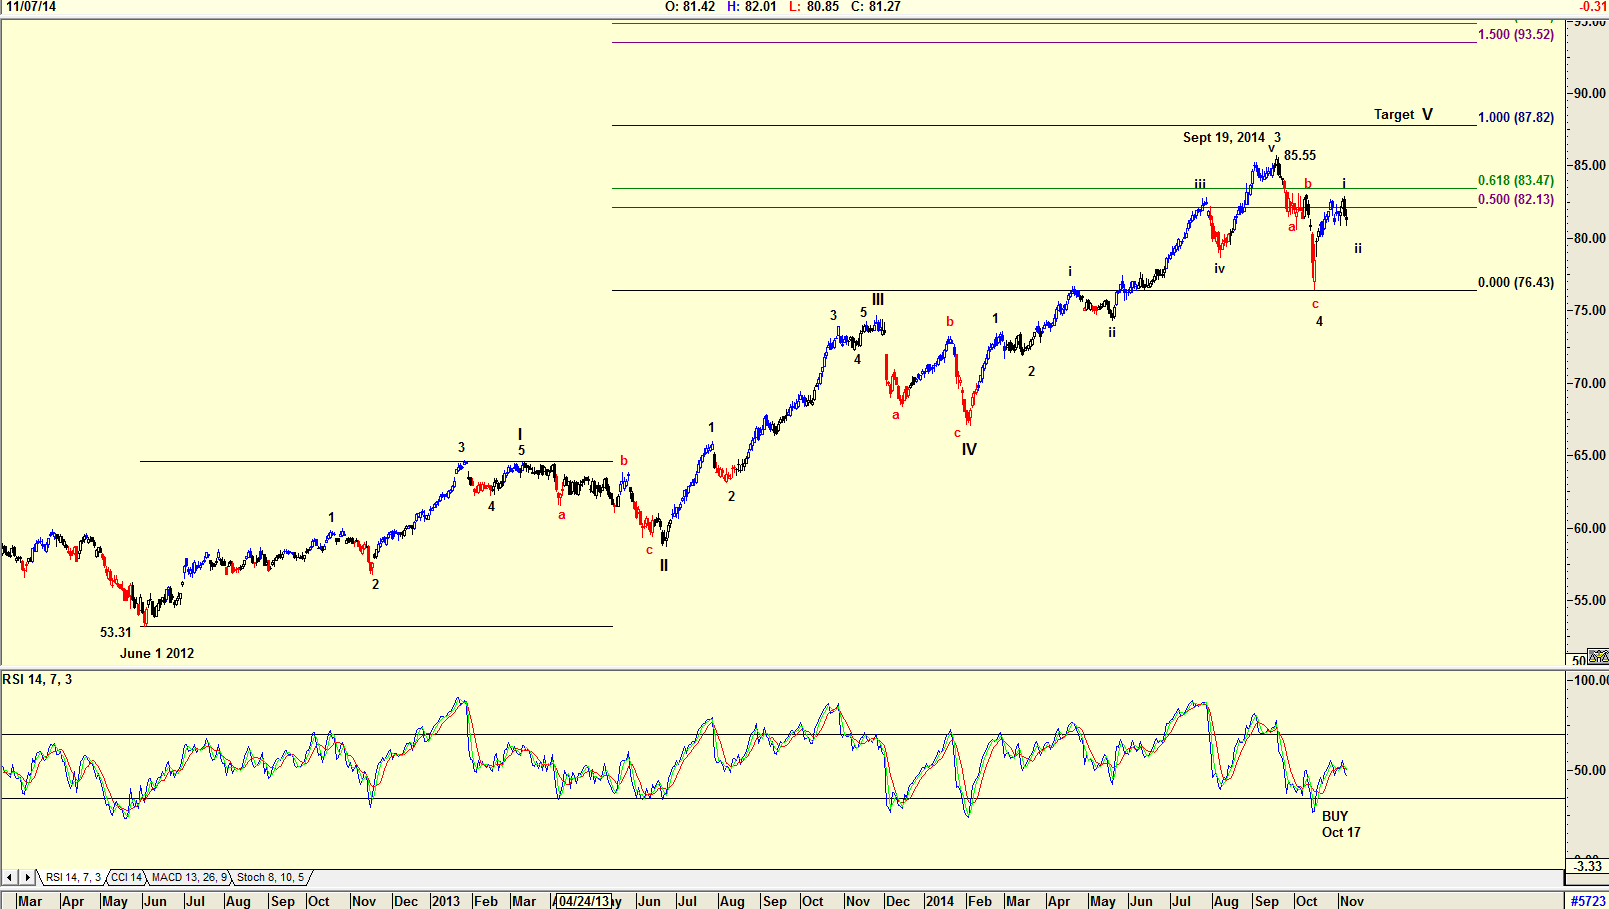
| Figure 1. Elliott Wave count of Bank of Montreal. The Elliott Wave rule suggests that the price could not be moving into a WAVE V which would suggest a target of $87.82. |
| Graphic provided by: AdvancedGET. |
| |
| The chart in Figure 1 is a daily chart of the Bank of Montreal. On February 26, 2009 the share price had fallen to a low of $24.66 from a high of $72.87 in April 2007. The share price quickly recovered to $64.10 by April 2010 when it moved in a sideways pattern with a low of $53.31 by June 1, 2012. The daily chart in Figure 1 is a chart from June 1, 2012 showing how the price rose from a low of $53.31 in June 2012 to a high of $85.55 by September 19, 2014. The Elliott Wave count suggests that the share price could now be moving into a WAVE V. The Elliott Wave rule suggests that a WAVE V should be equal to a WAVE I. This suggests a target of $87.82 as the minimum. Note the relative strength index (RSI) which gave a buy signal on October 17, 2014. |

|
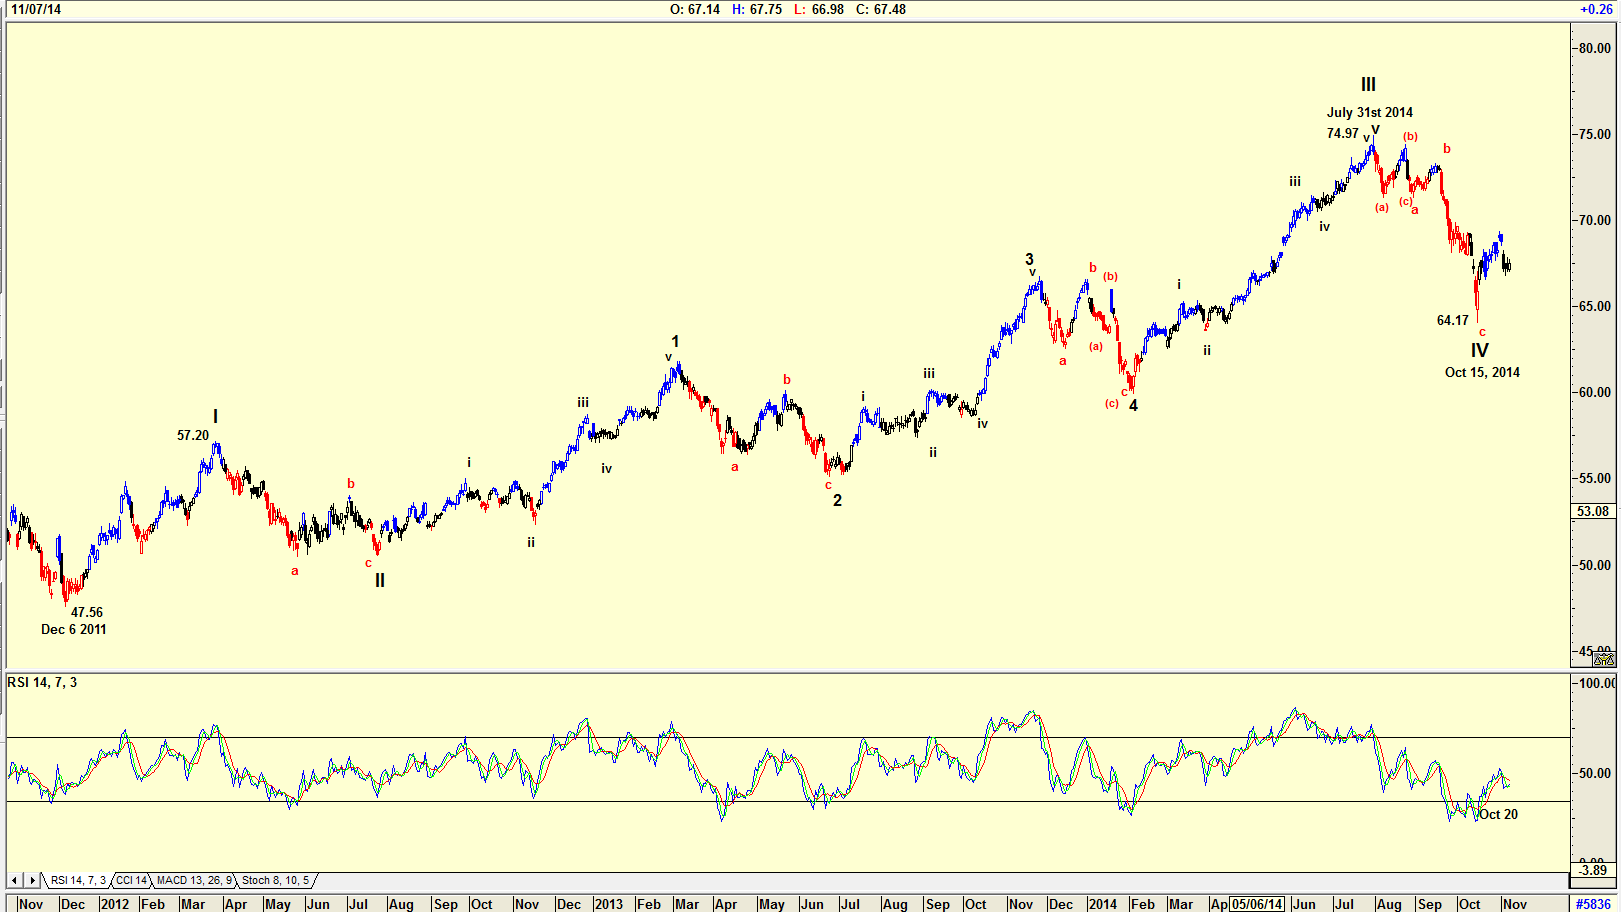
| Figure 2. Elliott Wave Count Of Scotia Bank. The Elliott Wave count again suggests that price could be moving into a WAVE V, with a suggested price target of $73.81. |
| Graphic provided by: AdvancedGET. |
| |
| The chart in Figure 2 is a daily chart of Scotia Bank, with an Elliott Wave count once again suggesting a WAVE IV pattern with the chart moving into a WAVE V. Once again the WAVE V target is equal to the length of WAVE I. The WAVE 1 length is 9.64 (57.20 - 47.56 = 9.64) which suggests a target of 73.81 (64.17 + 9.64 = 73.81). Once again the RSI indicator is moving up having given a buy signal on October 20, 2014. |

|
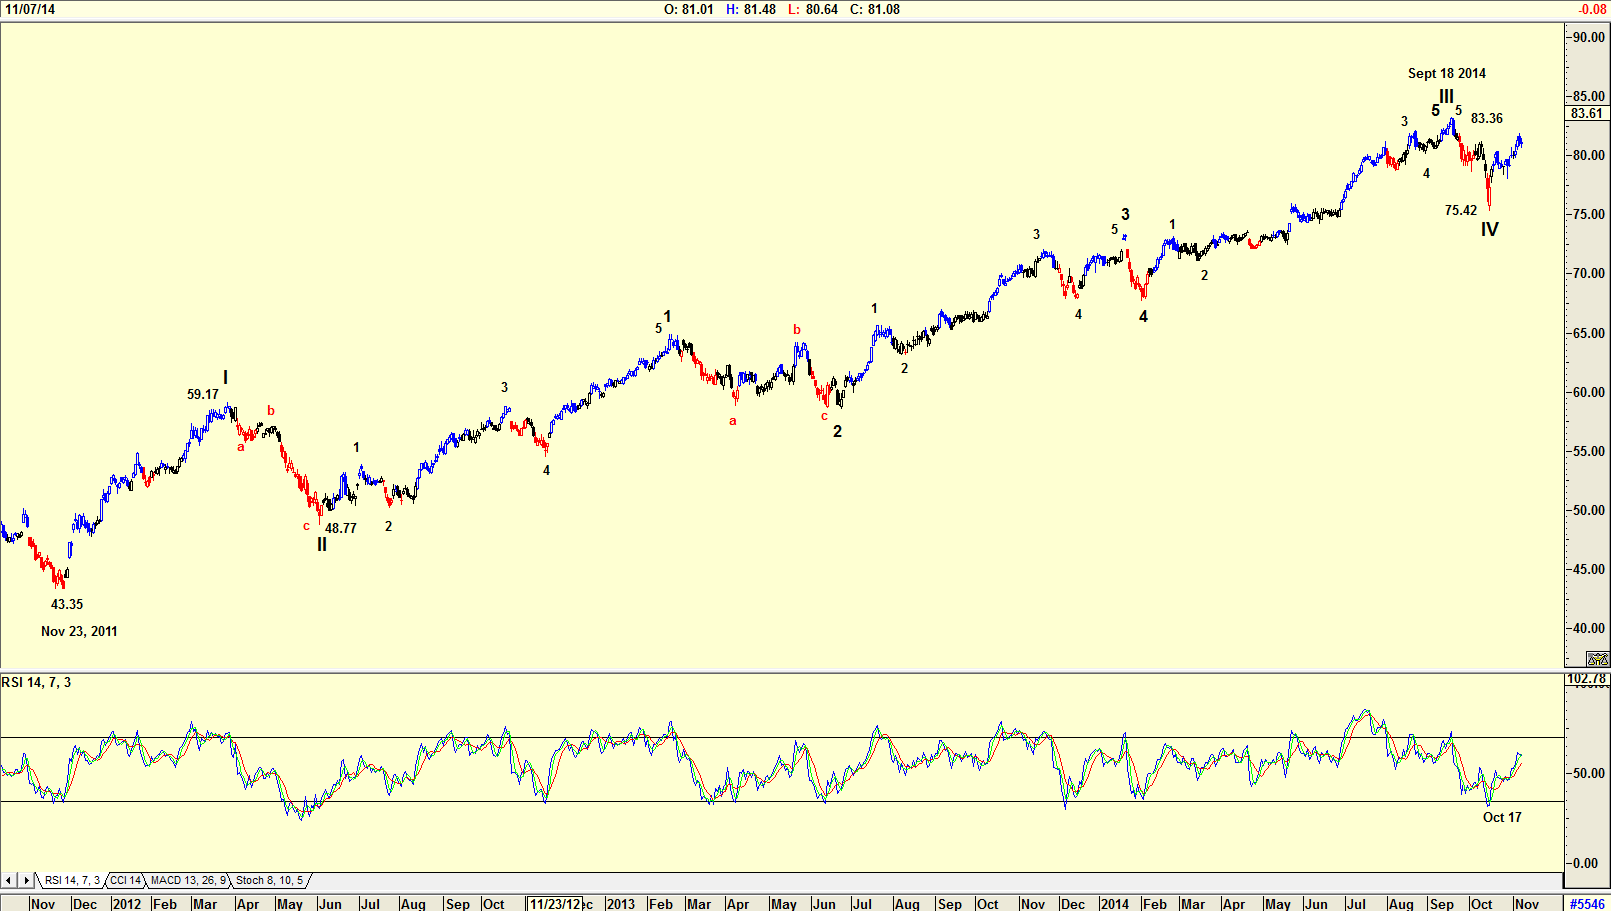
| Figure 3: Elliott Wave Count Of Royal Bank Of Canada. The WAVE V target for RBC is $91.24. |
| Graphic provided by: AdvancedGET. |
| |
| The chart in Figure 3 is a chart of the Royal Bank of Canada, showing how the price rose from $43.35 on November 23, 2011 to a high of $83.36 by September 18, 2014. Once again the target of WAVE V is that of WAVE I which is 15.82 (59.17 - 43.35 = 15.82). The WAVE V target is therefore 75.42 + 15.82 = $91.24. |

|
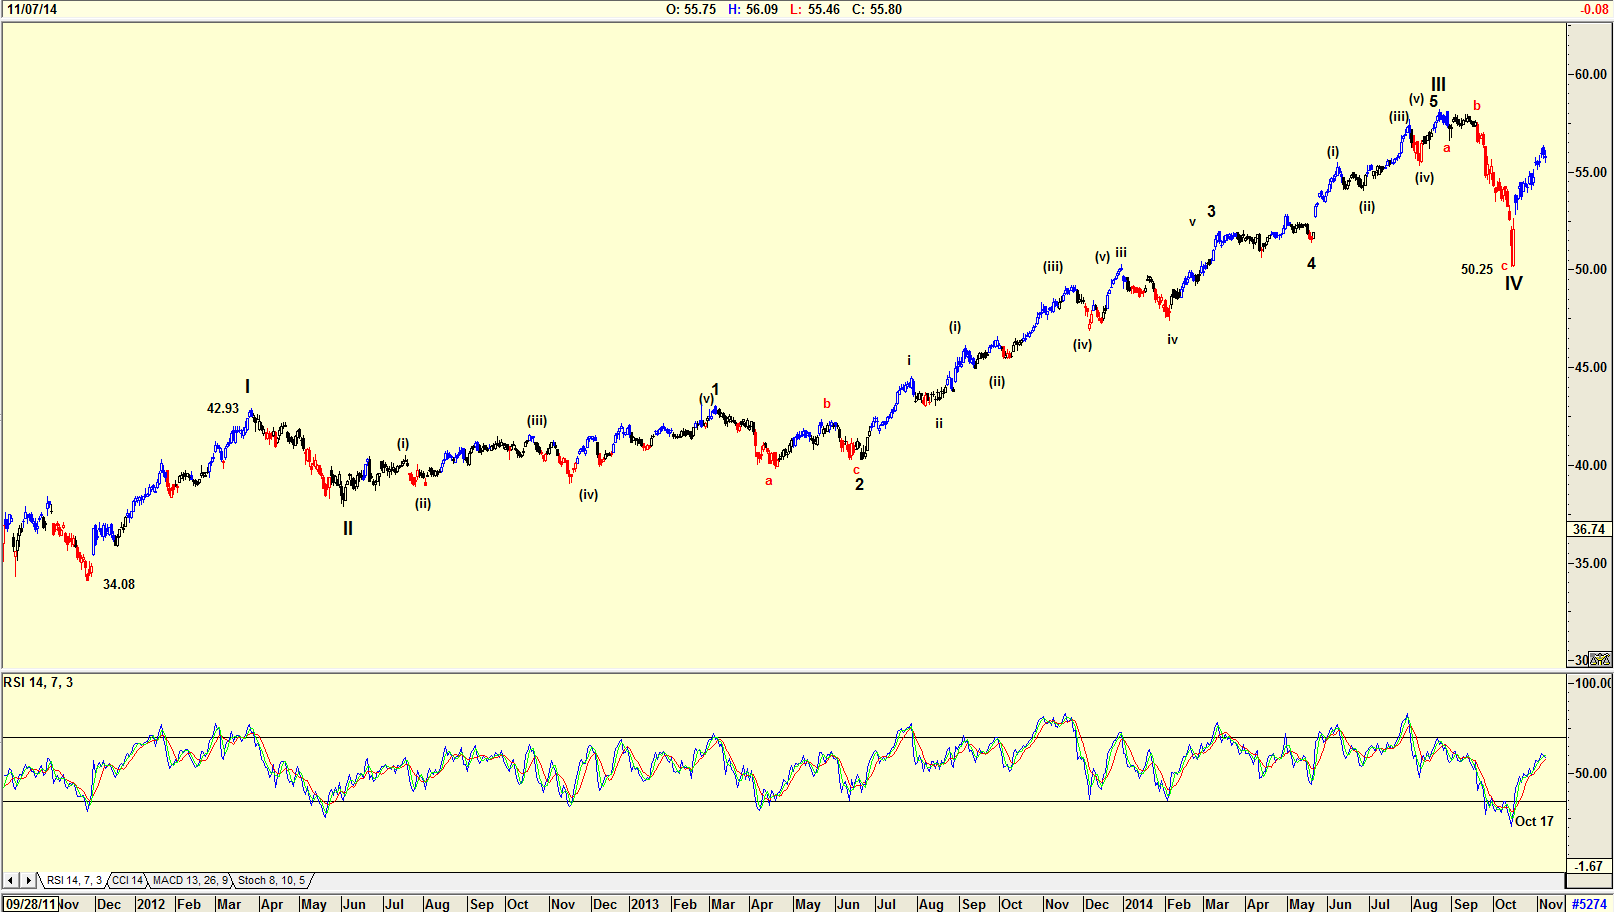
| Figure 4. Elliott Wave Count Of TD Bank. Another WAVE V projection wiht a target of $59.10. |
| Graphic provided by: AdvancedGET. |
| |
| The chart in Figure 4 is a chart of Toronto Dominion Bank. Once again the Elliott Wave count is suggesting that the share price is tracing a WAVE V and the target suggested is 50.25 + 8.85 = $59.10. (42.93-34.08 = 8.85). The RSI indicator gave a buy signal on October 17, 2014. All the Canadian banks are tracing the same Elliott Wave count, suggesting that they are all moving into a WAVE V. However, each bank is suggesting a different percentage rise with the target. The banks show that a rise is on the cards and with all the banks suggesting the same pattern, a purchase of a Canadian bank could be a successful investment. |
Has been a technical analyst since 1969, and has worked as a futures and options trader with First Financial Futures in Johannesburg, South Africa.
| Address: | 3256 West 24th Ave |
| Vancouver, BC | |
| Phone # for sales: | 6042634214 |
| E-mail address: | petroosp@gmail.com |
Click here for more information about our publications!
PRINT THIS ARTICLE

Request Information From Our Sponsors
- VectorVest, Inc.
- Executive Premier Workshop
- One-Day Options Course
- OptionsPro
- Retirement Income Workshop
- Sure-Fire Trading Systems (VectorVest, Inc.)
- Trading as a Business Workshop
- VectorVest 7 EOD
- VectorVest 7 RealTime/IntraDay
- VectorVest AutoTester
- VectorVest Educational Services
- VectorVest OnLine
- VectorVest Options Analyzer
- VectorVest ProGraphics v6.0
- VectorVest ProTrader 7
- VectorVest RealTime Derby Tool
- VectorVest Simulator
- VectorVest Variator
- VectorVest Watchdog
- StockCharts.com, Inc.
- Candle Patterns
- Candlestick Charting Explained
- Intermarket Technical Analysis
- John Murphy on Chart Analysis
- John Murphy's Chart Pattern Recognition
- John Murphy's Market Message
- MurphyExplainsMarketAnalysis-Intermarket Analysis
- MurphyExplainsMarketAnalysis-Visual Analysis
- StockCharts.com
- Technical Analysis of the Financial Markets
- The Visual Investor
