

HOT TOPICS LIST
- MACD
- Fibonacci
- RSI
- Gann
- ADXR
- Stochastics
- Volume
- Triangles
- Futures
- Cycles
- Volatility
- ZIGZAG
- MESA
- Retracement
- Aroon
INDICATORS LIST
LIST OF TOPICS
PRINT THIS ARTICLE
by Donald W. Pendergast, Jr.
Shares of the Market Vectors Semiconductor ETF are beginning a turn lower toward the $50.00 area.
Position: N/A
Donald W. Pendergast, Jr.
Freelance financial markets writer and online publisher of the Trendzetterz.com S&P 500 Weekly Forecast service.
PRINT THIS ARTICLE
ELLIOTT WAVE
SMH: Failure Swing Forecasts Pullback
11/11/14 12:48:44 PMby Donald W. Pendergast, Jr.
Shares of the Market Vectors Semiconductor ETF are beginning a turn lower toward the $50.00 area.
Position: N/A
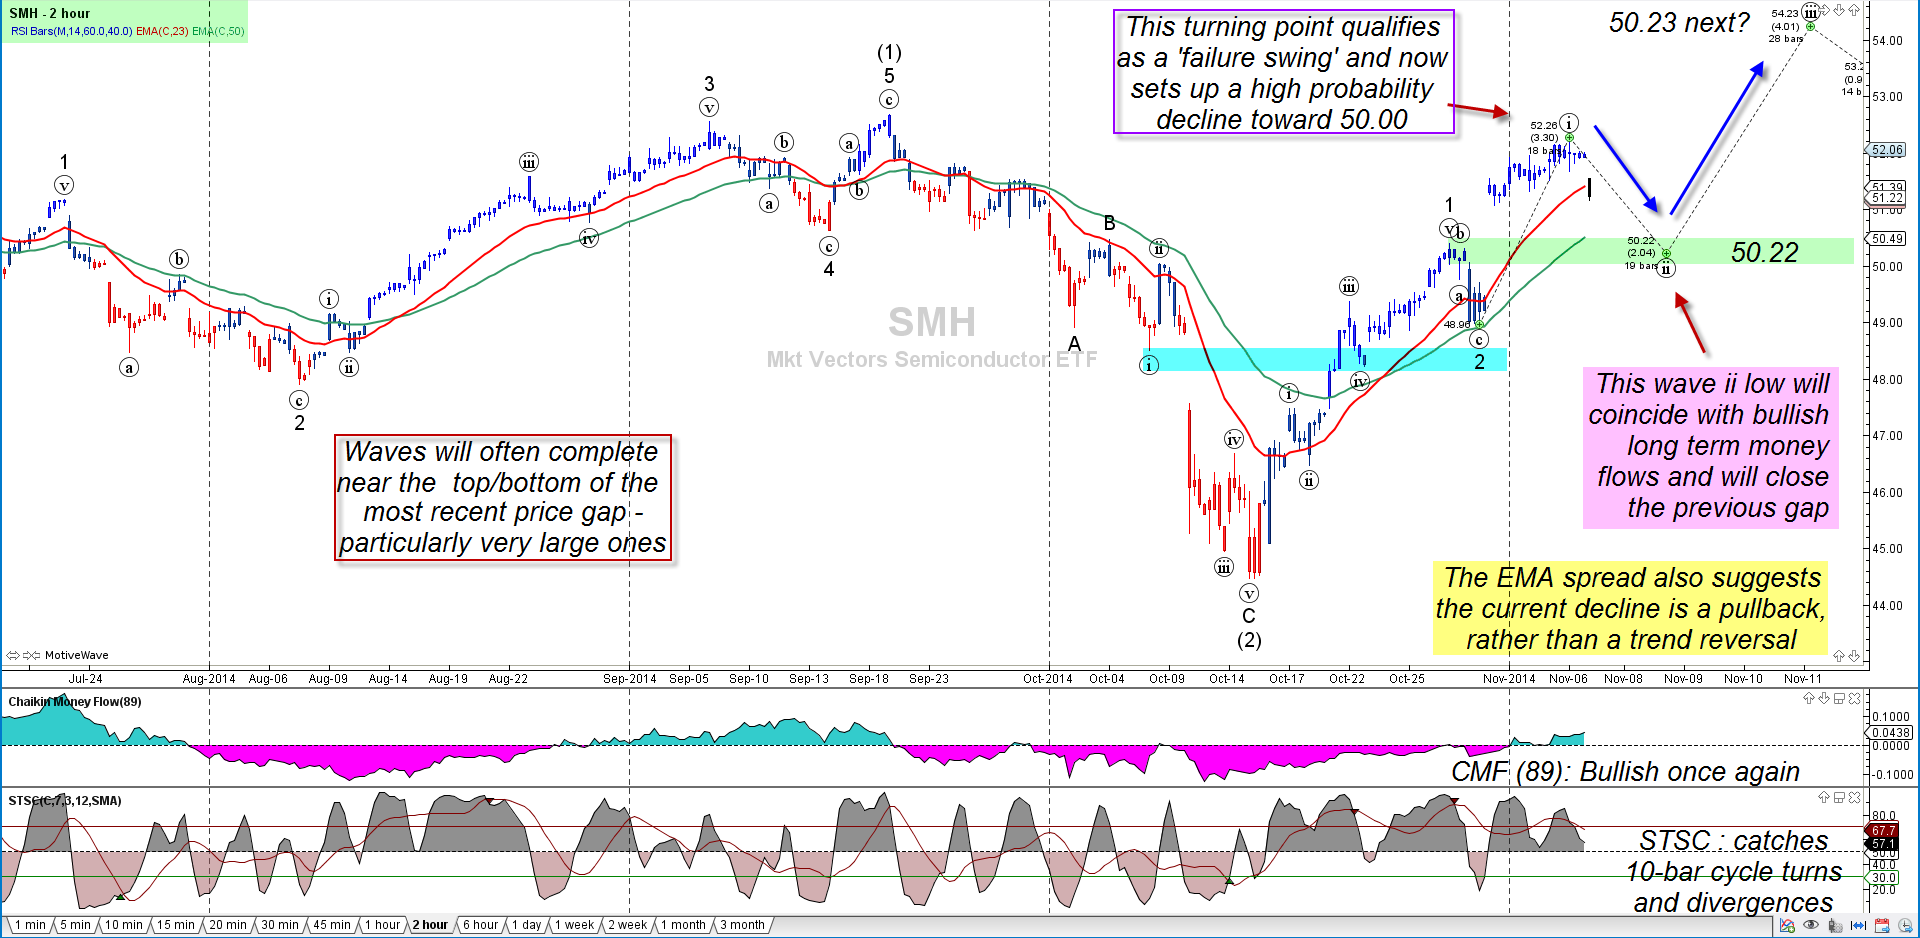
| The 120-minute chart of the Market Vectors Semiconductor ETF (SMH) frequently depicts beautiful — and tradable — Elliott Wave patterns, and the latest rally from the ashes of the October 15, 2014 lows is no exception. Here's a look at a high probability pullback underway, one that may offer a low-risk buying opportunity near the $50.00 area. |
|
| Figure 1. Where To From Here? The market Vectors Semiconductor ETF (SMH) still has a very bullish short-term profile based on this 120-minute Elliott wave pattern; if 50.22 fails to hold and the wave 2 low is subsequently broken, assume that a much deeper bear market lies ahead. |
| Graphic provided by: MotiveWave Ultimate from www.motivewave.com. |
| |
| It's not often that technicians witness a 'V' bottom in major stock indexes, but that's what occurred between the start of the rapid decline of September 2014, the bottom in October 2014 and the rapdid rebound into early November 2014; all of the major stock index ETFs like SPY, QQQ, DIA, and IWM have manifested the same sharp 'V', with all of them — except IWM — going on to exceed their September 2014 highs. This is all a little hard to believe, now that the bond-buying program by the Federal Reserve bank is being phased out, but it once again proves that traders and investors need to focus on what their charts are telling them and not pay so much attention to news reports or non-technical forecasts for the markets. SMH also had a sharp 'V' but failed to reach its previous high of 52.68 and is now pulling back in what should be a proportional wave ii low in the midst of a larger bullish wave structure (Figure 1). Long-term Chaikin Money Flow is now back above its zero line even as the spread between the red and green exponential moving averages (EMA) is relatively wide, with both averages sloping higher. Finally, the STSC stochastic histogram (bottom of chart) is dipping below its zero line; this indicator can also be used with a 10-bar detrend oscillator to help locate significant 10- and 20-day cycle lows in an uptrend (vice versa in a downtrend); if you see a subsequent STSC low at or near the 50.00 projected target price for wave ii, and the CMF(89) is still bullish (cyan color), you may have located a good, low risk long swing entry, one that has a potential impulse wave iii working in its favor. |
|
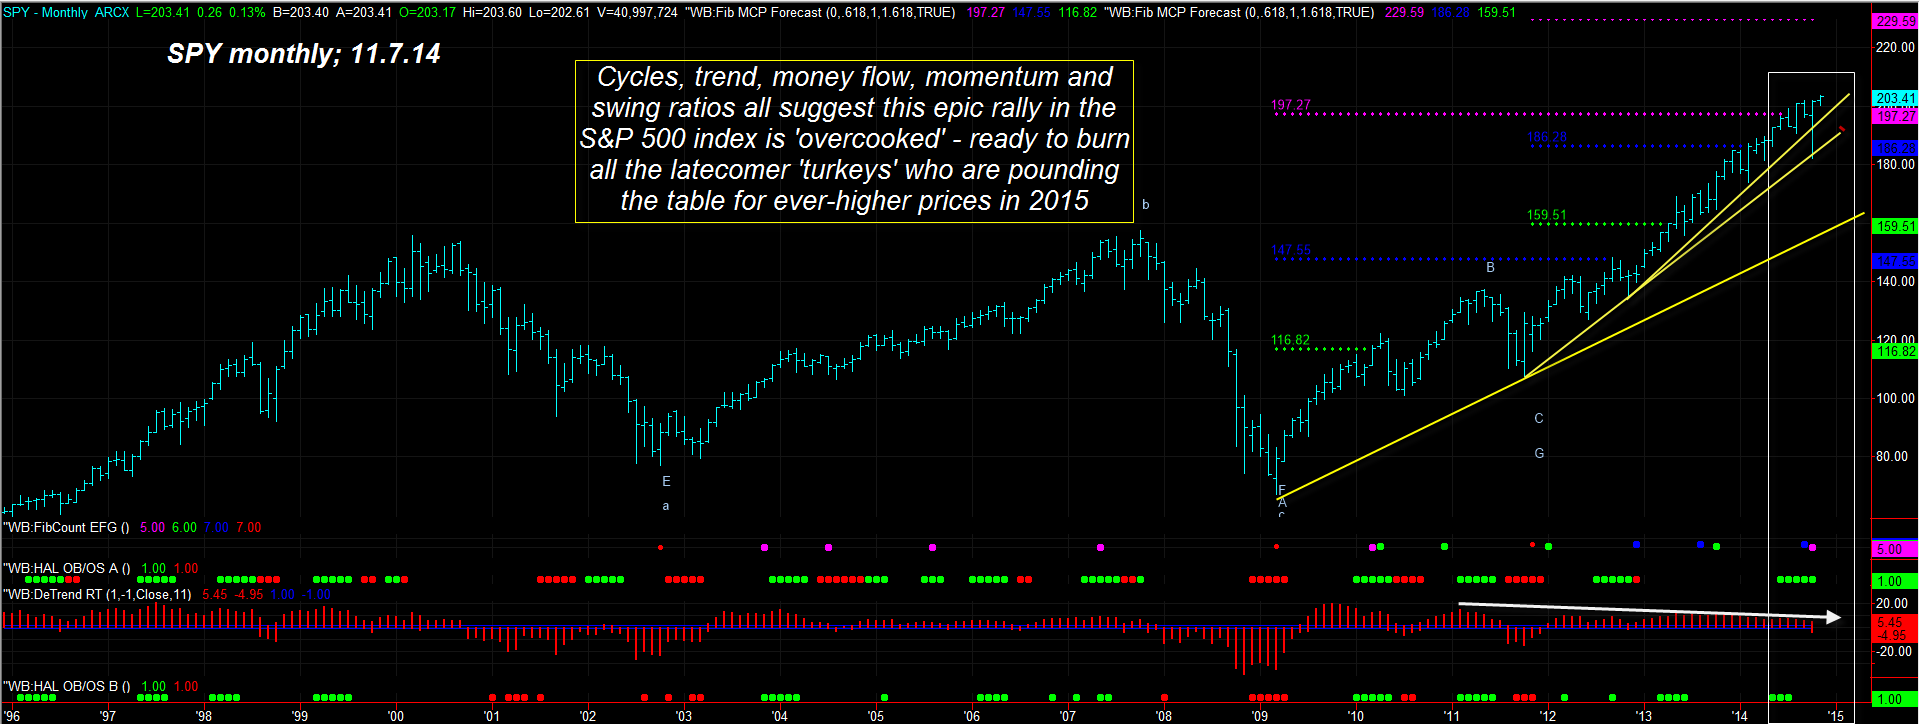
| Figure 2. Major Decline Ahead? The monthly chart of the S&P 500 index (.SPX. SPY) is warning of a major decline just ahead. |
| Graphic provided by: TradeStation. |
| Graphic provided by: ProfitTrader 7 from www.walterbressert.com. |
| |
| Analyzing SMH's higher time frame dynamics, here are other factors suggesting this wave ii pullback still has more room to go on the downside: 1. The daily chart reveals that SMH just hit a key daily cycles-based overbought time/price zone, with the 10- and 20-day cycles moving lower in unison. 2. SMH is decidedly underperforming SPY and QQQ once again. 3. The 18-month price cycle for SMH is sloping lower; while this has little immediate impact on the trading of a two-hour chart, it does suggest that if the wave iii does make it up toward 54.00 that this ETF could be setting up for a decline larger than that seen in September/October 2014. 4. SMH's 10-week cycle is sloping higher, but the first take-out of the October 31, 2014 low of 48.86 should see the weekly and monthly cycles in bearish agreement. The main takeaway here for SMH is this: a. Daily and 120-minute cycles suggest more downside — toward 50.00. b. A rally of some degree is likely if the 50.00-50.30 area holds as support. c. Weekly and monthly cycles may soon shift into bearish agreement after a decline from such a 120-minute chart rally, setting the stage for significant declines heading into 2015. d. For what it's worth, the primary 22- month cycle in the S&P 500 index (.SPX, SPY) has been warning of major bearish divergence since September 2013, with various Fibonacci time cycles anticipating a 'major' move in the monthly chart of the .SPX no later than the end of December 2014 (Figure 2). The astounding bull market since November 2012 is running out of steam, and when the break lower finally hits it's likely to be a doozy. SMH, QQQ and most industry groups may see significant bear declines in 2015/2016 based on such time/price patterns now appearing all across the US stock market landscape. Trade extra wisely until we meet here again. |
Freelance financial markets writer and online publisher of the Trendzetterz.com S&P 500 Weekly Forecast service.
| Title: | Market consultant and writer |
| Company: | Trendzetterz |
| Address: | 81 Hickory Hollow Drive |
| Crossville, TN 38555 | |
| Phone # for sales: | 904-303-4814 |
| Website: | trendzetterz.com |
| E-mail address: | support@trendzetterz.com |
Traders' Resource Links | |
| Trendzetterz has not added any product or service information to TRADERS' RESOURCE. | |
Click here for more information about our publications!
Comments
Date:�11/14/14Rank:�4Comment:�

Request Information From Our Sponsors
- VectorVest, Inc.
- Executive Premier Workshop
- One-Day Options Course
- OptionsPro
- Retirement Income Workshop
- Sure-Fire Trading Systems (VectorVest, Inc.)
- Trading as a Business Workshop
- VectorVest 7 EOD
- VectorVest 7 RealTime/IntraDay
- VectorVest AutoTester
- VectorVest Educational Services
- VectorVest OnLine
- VectorVest Options Analyzer
- VectorVest ProGraphics v6.0
- VectorVest ProTrader 7
- VectorVest RealTime Derby Tool
- VectorVest Simulator
- VectorVest Variator
- VectorVest Watchdog
- StockCharts.com, Inc.
- Candle Patterns
- Candlestick Charting Explained
- Intermarket Technical Analysis
- John Murphy on Chart Analysis
- John Murphy's Chart Pattern Recognition
- John Murphy's Market Message
- MurphyExplainsMarketAnalysis-Intermarket Analysis
- MurphyExplainsMarketAnalysis-Visual Analysis
- StockCharts.com
- Technical Analysis of the Financial Markets
- The Visual Investor