HOT TOPICS LIST
- MACD
- Fibonacci
- RSI
- Gann
- ADXR
- Stochastics
- Volume
- Triangles
- Futures
- Cycles
- Volatility
- ZIGZAG
- MESA
- Retracement
- Aroon
INDICATORS LIST
LIST OF TOPICS
PRINT THIS ARTICLE
by Gary Grosschadl
Once the real bottom hammer came into play, a nice trend reversal occurred for Avnet (AVT). Gaps on this chart add fuel to direction.
Position: N/A
Gary Grosschadl
Independent Canadian equities trader and technical analyst based in Peterborough
Ontario, Canada.
PRINT THIS ARTICLE
CHART ANALYSIS
Avnet's Telling Gaps And Tricky Bottom Hammers
10/31/02 08:33:12 AMby Gary Grosschadl
Once the real bottom hammer came into play, a nice trend reversal occurred for Avnet (AVT). Gaps on this chart add fuel to direction.
Position: N/A
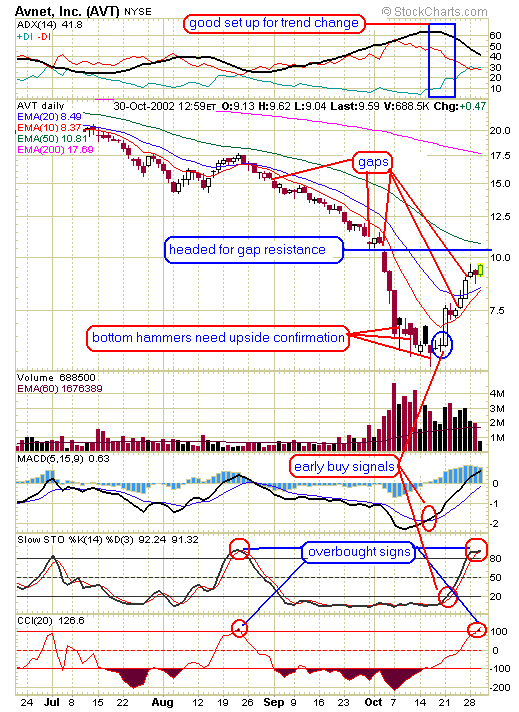
| The bear market brought this stock down hard like so many others. Notice how gaps served a telling role on the way down and on the way up. It should be no surprise that gaps accentuated the prevailing trend. Another notable feature with gaps is their role in future resistance and support. Stocks and indexes often pause or reverse at these points. Currently AVT is headed for likely stiff resistance at a prominent gap and 50-day moving average line, between $10.50 - $10.80. The displayed indicators - stochastics and CCI - are warning of overbought conditions giving some extra credence to coming resistance as outlined. |
| As the stock bottomed, several bottom hammer candlesticks developed but only one was properly bullishly confirmed to the upside. Traders trying to guess the bottom would have failed in the short term as the first two hammers never marked the real bottom. This is why you wait for upside confirmation ideally in the next day or two. This worked well in this example. |

|
| Graphic provided by: stockcharts.com. |
| |
| Looking for other confirming indicators agreeing with the bottom hammer, I see oversold signs from stochastics and MACD via their respective bullish crosses from low levels. Traders familiar with the directional movement indicator - ADX/DMI should also notice the potential bullish set up of "overheated ADX pushing for DI reversal." |
| This volatile stock has a colorful history and is worth keeping an eye on for trading opportunities. One may be coming up at the overhead gap for a possible reversal to previous gap if it holds. |
Independent Canadian equities trader and technical analyst based in Peterborough
Ontario, Canada.
| Website: | www.whatsonsale.ca/financial.html |
| E-mail address: | gwg7@sympatico.ca |
Click here for more information about our publications!
PRINT THIS ARTICLE

Request Information From Our Sponsors
- VectorVest, Inc.
- Executive Premier Workshop
- One-Day Options Course
- OptionsPro
- Retirement Income Workshop
- Sure-Fire Trading Systems (VectorVest, Inc.)
- Trading as a Business Workshop
- VectorVest 7 EOD
- VectorVest 7 RealTime/IntraDay
- VectorVest AutoTester
- VectorVest Educational Services
- VectorVest OnLine
- VectorVest Options Analyzer
- VectorVest ProGraphics v6.0
- VectorVest ProTrader 7
- VectorVest RealTime Derby Tool
- VectorVest Simulator
- VectorVest Variator
- VectorVest Watchdog
- StockCharts.com, Inc.
- Candle Patterns
- Candlestick Charting Explained
- Intermarket Technical Analysis
- John Murphy on Chart Analysis
- John Murphy's Chart Pattern Recognition
- John Murphy's Market Message
- MurphyExplainsMarketAnalysis-Intermarket Analysis
- MurphyExplainsMarketAnalysis-Visual Analysis
- StockCharts.com
- Technical Analysis of the Financial Markets
- The Visual Investor
