HOT TOPICS LIST
- MACD
- Fibonacci
- RSI
- Gann
- ADXR
- Stochastics
- Volume
- Triangles
- Futures
- Cycles
- Volatility
- ZIGZAG
- MESA
- Retracement
- Aroon
INDICATORS LIST
LIST OF TOPICS
PRINT THIS ARTICLE
by Donald W. Pendergast, Jr.
Shares of Caterpillar, Inc. may be preparing for another decline as a daily cycle high meets with weekly chart resistance.
Position: N/A
Donald W. Pendergast, Jr.
Freelance financial markets writer and online publisher of the Trendzetterz.com S&P 500 Weekly Forecast service.
PRINT THIS ARTICLE
CYCLES
CAT: Low-Risk Short?
11/06/14 05:37:32 PMby Donald W. Pendergast, Jr.
Shares of Caterpillar, Inc. may be preparing for another decline as a daily cycle high meets with weekly chart resistance.
Position: N/A
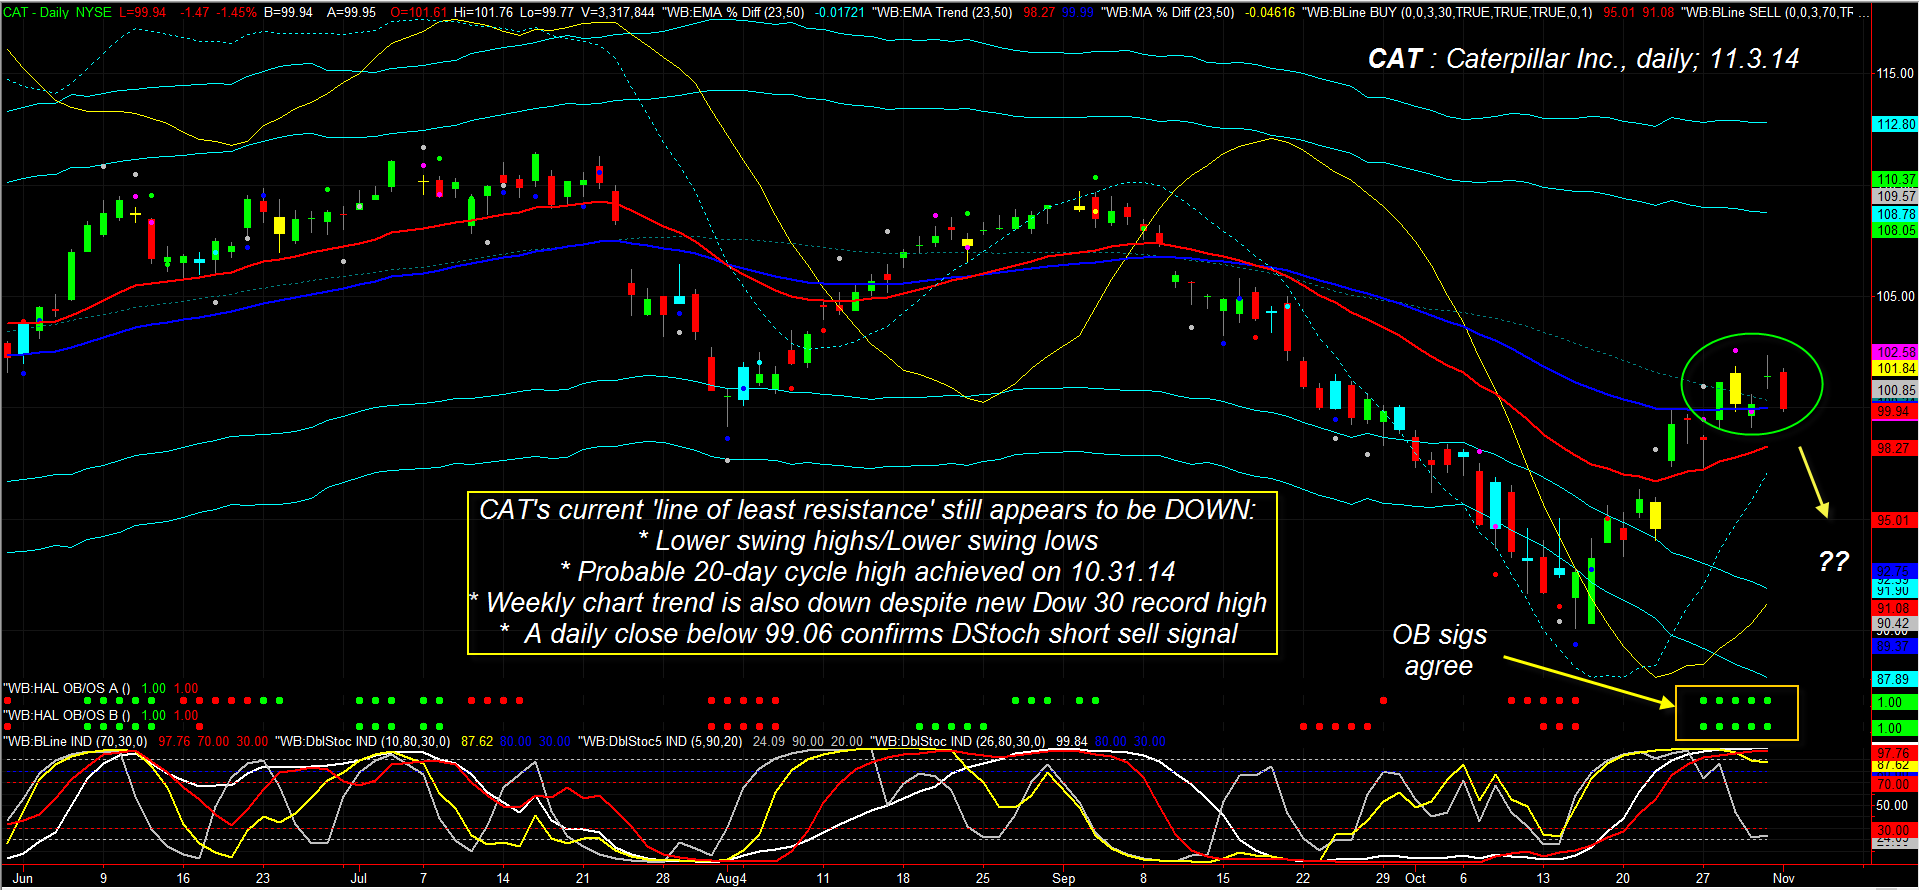
| Shares of Caterpillar Inc. (CAT), like most other Dow 30 (.DJX) and S&P 500 (.SPX) index stocks, was hammered hard in the September/October 2014 sell-off; in similar fashion, the stock has also enjoyed a rebound rally — up nearly 14% from the October 15, 2014 lows — but the rally was very weak in comparison to that seen in the Dow and S&P 500 indexes. This weakness in CAT is setting up a high probability short trade, one that has price cycles and dominant trend forces clearly aligned in its favor. Here's a closer look now (Figure 1). |

|
| Figure 1. Caterpillar Inc. (CAT) Cycles. This Dow 30 component had only half as strong a rebound rally as its parent index; cycles and trend analysis suggest bigger declines ahead for this industrial/capital goods sector giant. |
| Graphic provided by: TradeStation. |
| Graphic provided by: ProfitTrader 7 from www.walterbressert.com. |
| |
| Educated deployment of price cycle and trend analysis can frequently uncover a variety of low-risk, high probability trade setups on numerous time frames in all freely traded, liquid financial markets; the recent sell off in the major US stock indexes found its October 15, 2014 low as several price cycles bottomed together, setting the stage for what has developed into an unusually powerful relief rally. CAT also found strong support as its 18-, 48-, and 69-day cycles bottomed in unison three weeks ago. Here were the major confirmations that the low was in place: 1. The DBS5, DBS10 and B-Line oscillators bottomed simultaneously 2. The DBS30 oscillator was also deeply oversold 3. The red OS band (horizontal dots) had also projected a possible 18-20 day cycle low between October 11, 2014 and October 15, 2014. 4. The 90.00 price level also coincided with an area of historically heavy trading volume (not shown), implying it to be a strong support level. 5. Just prior to the October 15, 2014 low, CAT had actually dipped below both of the lower Keltner channels, which is in many cases a high probability precedent to trend exhaustion and reversal. Essentially, these oscillators (which tend to track cyclical movement with accuracy), support, and trend exhaustion timing tools were able to make a very reliable cycle bottom forecast in this heavily traded industrial/capital goods sector stock. Now, while no one could have known that CAT would afterward bounce by nearly 14% in only 12 trading sessions, for those cycle technicians who realized that a multicycle low was in place would have had more confidence in timing a bullish reversal entry in CAT (based on daily and weekly chart buy signals as multiple cycles began to move higher). Since sharp traders also know that higher time frame trend also exerts strong influence on a trading time frame chart, they also would have seen the marks of a downtrend written all over the charts: 1. The daily chart still had a series of lower swing highs and lower swing lows. 2. The weekly chart (not shown) had a narrowing (bearish) moving average spread, confirming downward momentum. Given the daily/weekly downward trend bias, any bounce higher from the mid-October lows was most likely going to be a bear market bounce, rather than a major reversal for CAT. Sure enough, a series of green overbought (OB) timing bands appeared as the trend faded in late October; these were warnings for existing longs to prepare to trail their positions more closely and or to scale out altogether. As to the question of which cycle actually topped on October 31, 2014, there are two possibilities: A. The 18-20 day cycle topped and is now ready to roll over, with a new cycle low expected by November 11, 2014. B. The larger 48-day cycle has fizzled on the rebound and is now preparing for a large descent into a major low that may not be seen until late November/early December 2014. Given the bearish trend momentum, perhaps scenario 'B' is the most probable outcome as 2014 comes to a close. |

|
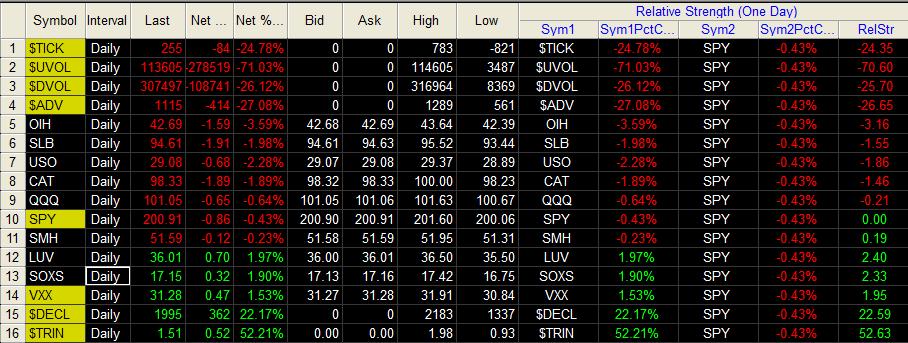
| Figure 2. Relative Performance. CAT has a down day on November 4, 2014, as the market elects to sell it off again. Note that LUV continues to outperform as crude oil prices continue to collapse. |
| Graphic provided by: TradeStation. |
| Graphic provided by: TradeStation 9.1 RadarScreen. |
| |
| Any drop below 99.06 in CAT sets up a new short trade, one that has a bearish weekly trend strongly in its favor; traders can elect to use 101.90 as the initial stop, managing the position with a 2- to 4- bar trailing stop. Traders with a longer-term bearish outlook for CAT should also be aware of this: 1. The 22-week cycle is not anticipated to bottom until at least January 23, 2015. 2. The minimum weekly price target based on Fibonacci swing ratios is at 90.21; the next targets are at 82.69 and 70.53, respectively. There is an open gap near 96.00 on CAT's daily chart; expect that to be a profit-taking zone for shorts. Further declines beneath the gap set up a likely retest of the October 15, 2014 low at 90.05. By all measures it looks like the big bad bear (market) is going to be feasting on CAT this Thanksgiving. Trade wisely until we meet here again. |
Freelance financial markets writer and online publisher of the Trendzetterz.com S&P 500 Weekly Forecast service.
| Title: | Market consultant and writer |
| Company: | Trendzetterz |
| Address: | 81 Hickory Hollow Drive |
| Crossville, TN 38555 | |
| Phone # for sales: | 904-303-4814 |
| Website: | trendzetterz.com |
| E-mail address: | support@trendzetterz.com |
Traders' Resource Links | |
| Trendzetterz has not added any product or service information to TRADERS' RESOURCE. | |
Click here for more information about our publications!
PRINT THIS ARTICLE

Request Information From Our Sponsors
- StockCharts.com, Inc.
- Candle Patterns
- Candlestick Charting Explained
- Intermarket Technical Analysis
- John Murphy on Chart Analysis
- John Murphy's Chart Pattern Recognition
- John Murphy's Market Message
- MurphyExplainsMarketAnalysis-Intermarket Analysis
- MurphyExplainsMarketAnalysis-Visual Analysis
- StockCharts.com
- Technical Analysis of the Financial Markets
- The Visual Investor
- VectorVest, Inc.
- Executive Premier Workshop
- One-Day Options Course
- OptionsPro
- Retirement Income Workshop
- Sure-Fire Trading Systems (VectorVest, Inc.)
- Trading as a Business Workshop
- VectorVest 7 EOD
- VectorVest 7 RealTime/IntraDay
- VectorVest AutoTester
- VectorVest Educational Services
- VectorVest OnLine
- VectorVest Options Analyzer
- VectorVest ProGraphics v6.0
- VectorVest ProTrader 7
- VectorVest RealTime Derby Tool
- VectorVest Simulator
- VectorVest Variator
- VectorVest Watchdog
