HOT TOPICS LIST
- MACD
- Fibonacci
- RSI
- Gann
- ADXR
- Stochastics
- Volume
- Triangles
- Futures
- Cycles
- Volatility
- ZIGZAG
- MESA
- Retracement
- Aroon
INDICATORS LIST
LIST OF TOPICS
PRINT THIS ARTICLE
by Koos van der Merwe
Television announcers on Bloomberg, CNBC, CNN, or any other financial TV channel look at fundamentals, but do the technicals agree with what they say?
Position: Sell
Koos van der Merwe
Has been a technical analyst since 1969, and has worked as a futures and options trader with First Financial Futures in Johannesburg, South Africa.
PRINT THIS ARTICLE
GAPS
Is Visa A Buy?
11/04/14 05:07:31 PMby Koos van der Merwe
Television announcers on Bloomberg, CNBC, CNN, or any other financial TV channel look at fundamentals, but do the technicals agree with what they say?
Position: Sell
| Fundamental analysis tells an investor that a company is worth investing in for the long-term, or whether an investor should avoid the company because its financial figures do not meet expectations. Technical analysis on the other hand, looks at how traders and investors look at the price of the share today or for the immediate future, based on the past performance of those who bought or sold the share. So, for those who are looking for a long-term buy & hold purchase, fundamental analysis is the answer. For those looking for a short-term or longer profit or for cutting a loss on a share already held, technical analysis is the answer. Shares of Visa (V) have recently been recommended as a long-term buy. What do the technicals say? |

|
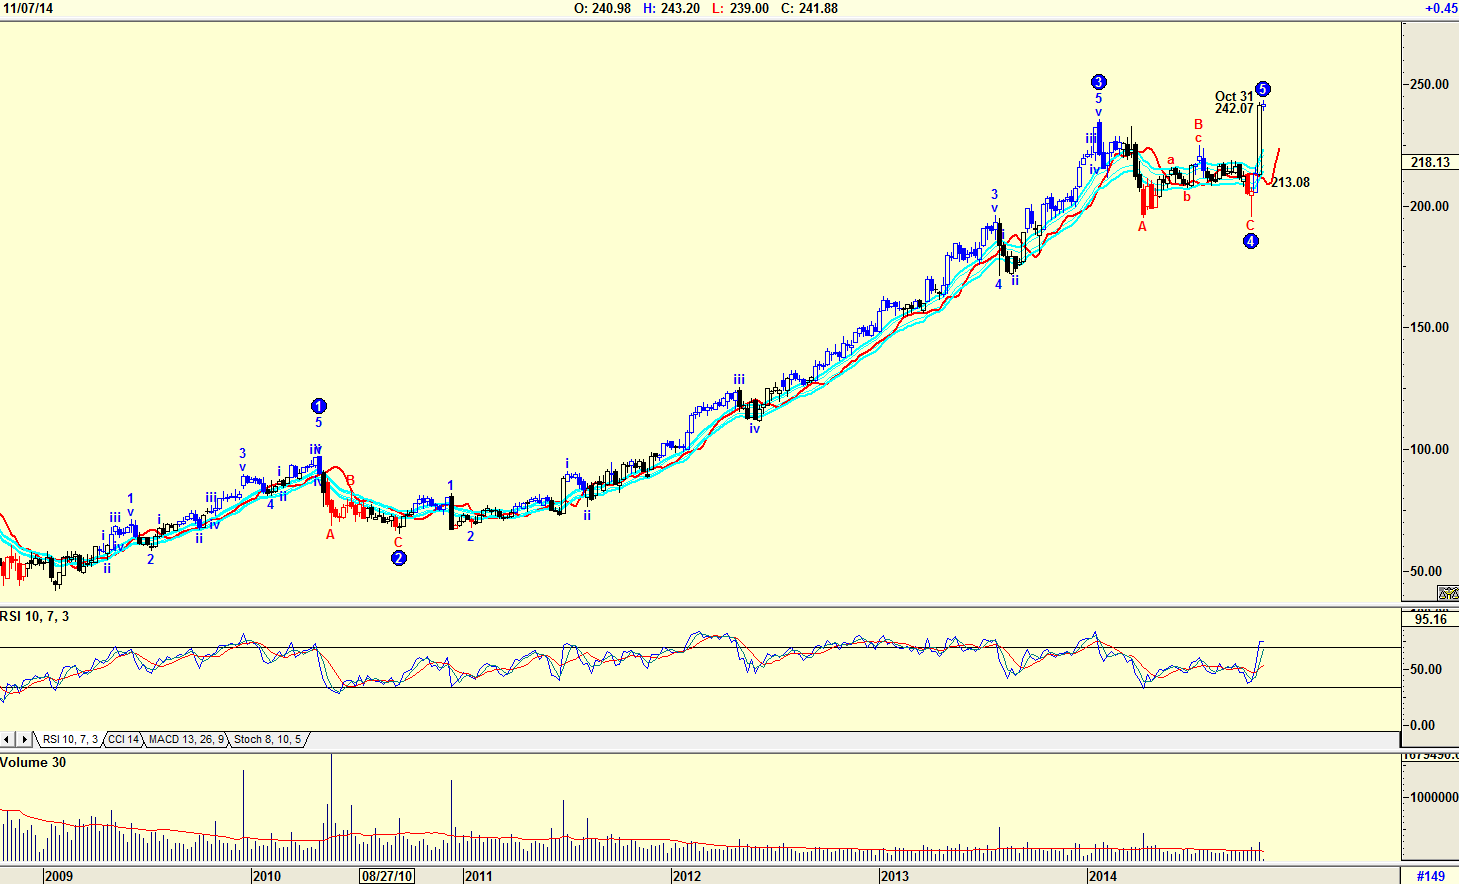
| Figure 1. Elliott Waves. Here on this weekly chart of Visa (V), the Elliott Wave count suggests that a WAVE 5 has been completed and the stock price could start falling in an ABC correction. |
| Graphic provided by: AdvancedGET. |
| |
| The chart in Figure 1 is a weekly chart of V with an Elliott wave count suggesting that a WAVE 5 has been completed, and that the share price should start falling in an ABC correction. Note how strongly the share rose over the week ending October 31, 2014 rising in one week from $213.08 to $242.07. The share price rose after the company was upgraded to "buy" from "hold" at Argus Research where analysts at the research firm set a price target of $260 on the shares. The raise in rating at Argus came after V reported stronger than expected third quarter earnings. Note the relative strength index (RSI) which is at overbought levels, but has not yet given a sell signal. |

|
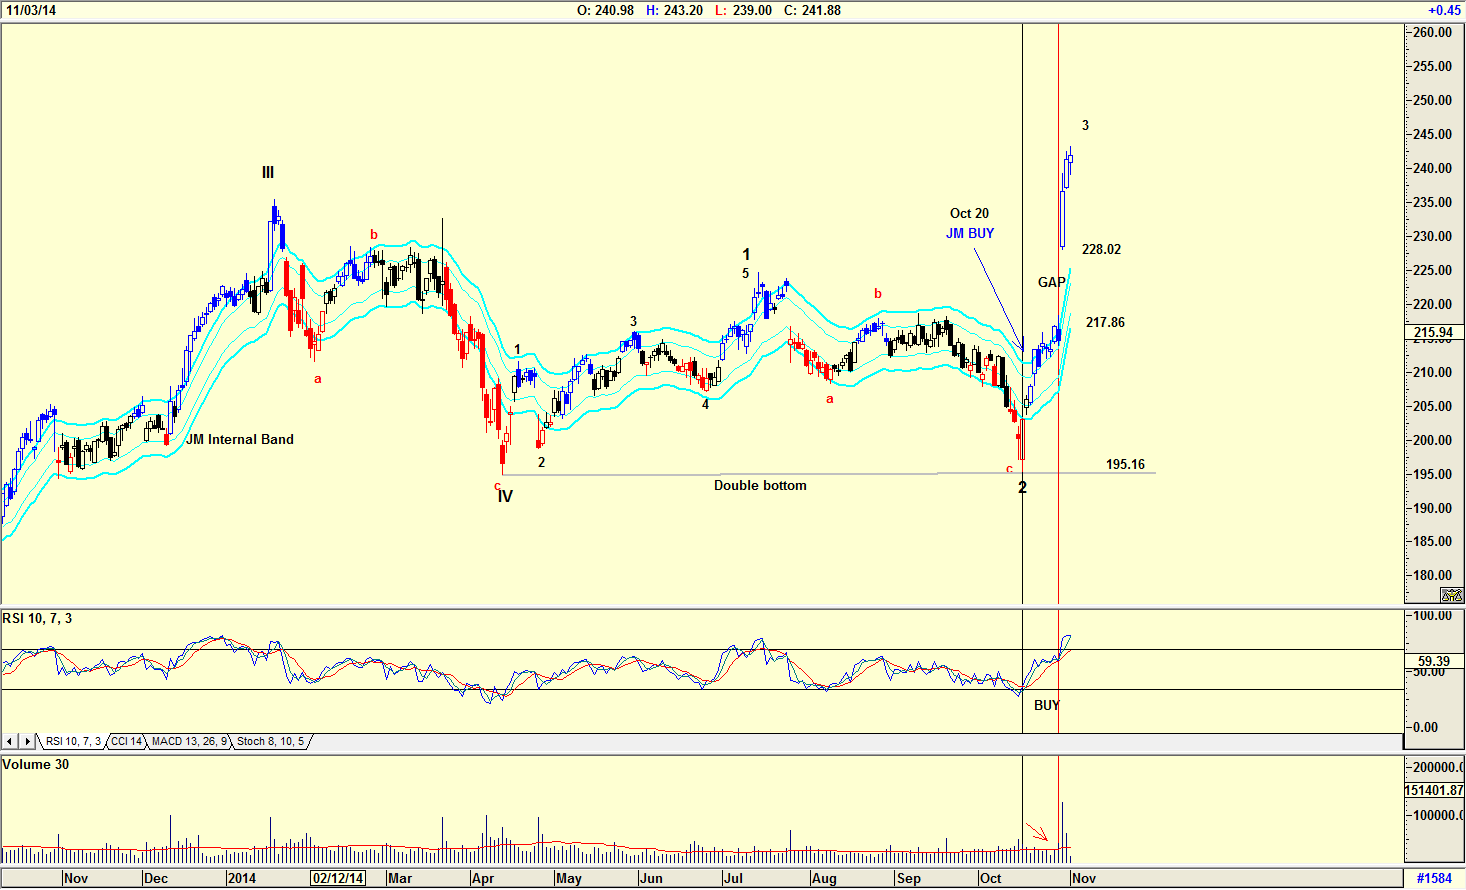
| Figure 2. Filling The Gap. On this daily chart notice the gap on high volume. With the RSI at overbought levels, you can expect the share price to fall and fill the gap. |
| Graphic provided by: AdvancedGET. |
| |
| The chart in Figure 2 is a daily chart with an Elliott wave count suggesting that the share price could be tracing a wave 3 of a WAVE V. Note how the share price formed a double bottom with Wave 2 of WAVE V. The Elliott rule is that a wave 2 can retrace 100% or even greater of a wave 1. With the RSI suggesting a buy as the share price bounced off the double bottom, you could have bought the share. However, note the falling volume as the share price rose, a sign of weakness. Volume only started rising when the RSI was at overbought levels, as shown by the red vertical line on the chart. Then came the gap, on high volume, but once again volume started falling as the share price made new highs. With the RSI now at overbought levels, you can expect the share price to fall and fill the gap. Would I have been a buyer of V shares? Probably, as the share gave a JM Internal band buy signal on October 20, 2014 but not expecting a sudden share increase on the gap as shown on the chart. A JM Internal band is a 15-period simple moving average offset by 2% positive and 2% negative. A break above the upper band suggests a buy. However with the RSI at overbought levels, and expecting the share price to fall and "fill the gap," I would have been a seller into strength as the share price continued rising. |
Has been a technical analyst since 1969, and has worked as a futures and options trader with First Financial Futures in Johannesburg, South Africa.
| Address: | 3256 West 24th Ave |
| Vancouver, BC | |
| Phone # for sales: | 6042634214 |
| E-mail address: | petroosp@gmail.com |
Click here for more information about our publications!
PRINT THIS ARTICLE

|

Request Information From Our Sponsors
- VectorVest, Inc.
- Executive Premier Workshop
- One-Day Options Course
- OptionsPro
- Retirement Income Workshop
- Sure-Fire Trading Systems (VectorVest, Inc.)
- Trading as a Business Workshop
- VectorVest 7 EOD
- VectorVest 7 RealTime/IntraDay
- VectorVest AutoTester
- VectorVest Educational Services
- VectorVest OnLine
- VectorVest Options Analyzer
- VectorVest ProGraphics v6.0
- VectorVest ProTrader 7
- VectorVest RealTime Derby Tool
- VectorVest Simulator
- VectorVest Variator
- VectorVest Watchdog
- StockCharts.com, Inc.
- Candle Patterns
- Candlestick Charting Explained
- Intermarket Technical Analysis
- John Murphy on Chart Analysis
- John Murphy's Chart Pattern Recognition
- John Murphy's Market Message
- MurphyExplainsMarketAnalysis-Intermarket Analysis
- MurphyExplainsMarketAnalysis-Visual Analysis
- StockCharts.com
- Technical Analysis of the Financial Markets
- The Visual Investor
