

HOT TOPICS LIST
- MACD
- Fibonacci
- RSI
- Gann
- ADXR
- Stochastics
- Volume
- Triangles
- Futures
- Cycles
- Volatility
- ZIGZAG
- MESA
- Retracement
- Aroon
INDICATORS LIST
LIST OF TOPICS
PRINT THIS ARTICLE
by Donald W. Pendergast, Jr.
Stocks in the semiconductor industry group may be primed for another correction after an unusually strong relief rally.
Position: N/A
Donald W. Pendergast, Jr.
Freelance financial markets writer and online publisher of the Trendzetterz.com S&P 500 Weekly Forecast service.
PRINT THIS ARTICLE
DECLINING TREND
SMH: Ready To Correct?
11/03/14 05:16:46 PMby Donald W. Pendergast, Jr.
Stocks in the semiconductor industry group may be primed for another correction after an unusually strong relief rally.
Position: N/A
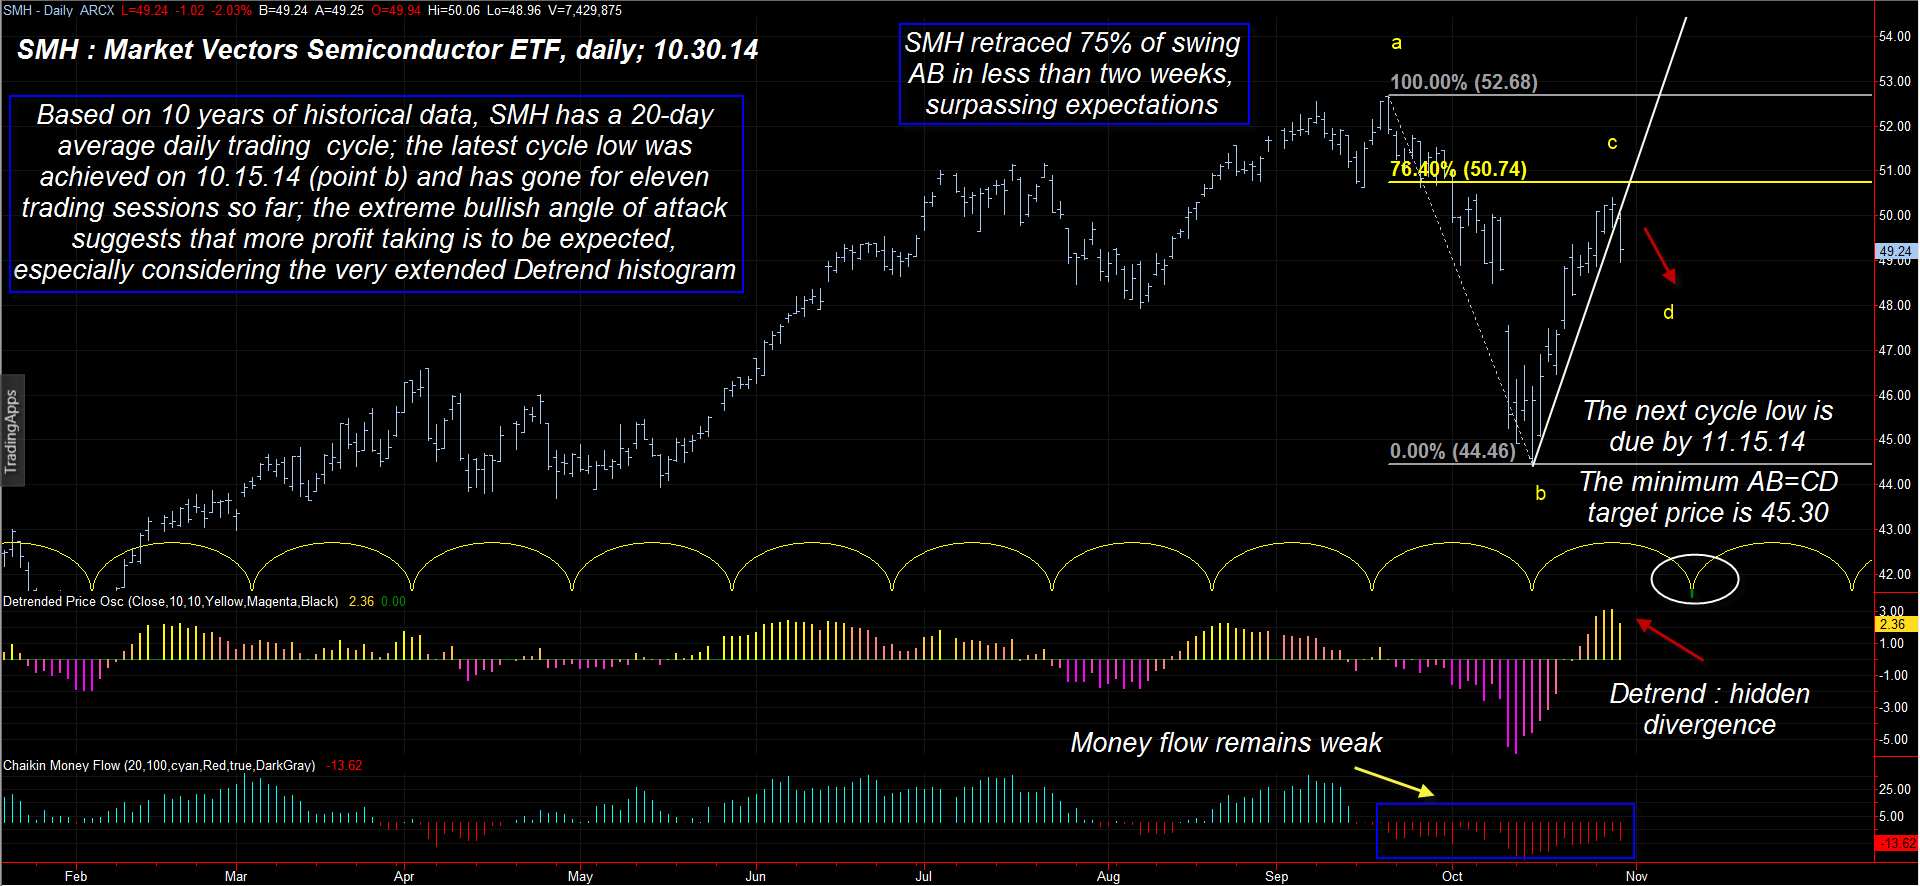
| The Market Vectors Semiconductor ETF (SMH) has rebounded strongly over the past two weeks, recovering 75% of the steep decline witnessed in late September-early October 2014; here's a look at its price cycle, money flow, and swing structure, all of which suggests another move lower in the next couple of weeks (Figure 1). |
|
| Figure 1. Daily Chart Of Market Vectors Semiconductors ETF (SMH): The current relief rally may have already run its course, with swing CD prepared to take prices back into the mid-$40 range. |
| Graphic provided by: TradeStation. |
| |
| The violent sell-off that recently engulfed the broad US markets has all but been forgotten in an equally powerful (almost) short-covering rally, one that has seen the S&P 500 index (.SPX) recover nearly 85% of its September 19-October 15 losses, while SMH has recovered nearly as robustly. However, while .SPX is still showing tremendous strength, SMH is already diverging from the broad stock indexes and now looks set to complete bearish swing CD of a large AB=CD pattern: 1. The 21-day Chaikin Money Flow (CMF)(21) histogram reveals anemic volume. 2. The 10-period detrend oscillator is stretched far beyond the norm, confirming a hidden divergence pattern on the daily chart. 3. SMH is well within the window for its 20-day cycle high to form. 4. Having reached the 75% retracement level at such a time of divergence, weak money flow, and an expected cycle high, the line of least resistance for SMH now appears to be back down to form a completed AB=CD price pattern. The .618 target price for swing CD is 45.30 and the next 20-day cycle low is anticipated around the middle of November 2014; price cycles will expand and contract depending on market conditions, but at least we have an approximate 'look and see' completion date to be aware of. If you see SMH make a daily close beneath 48.96 on big volume, expect to see plenty more downside into the mid-$40 range during the first half of November 2014; this could be a good long put play, using modestly in-the-money options with at least two to three months of time value remaining. If this ETF gets down anywhere near $45.30, taking profits and walking away would be a sound strategy, lest another short covering rally erupts, wiping out much in the way of hard-won gains. |
|
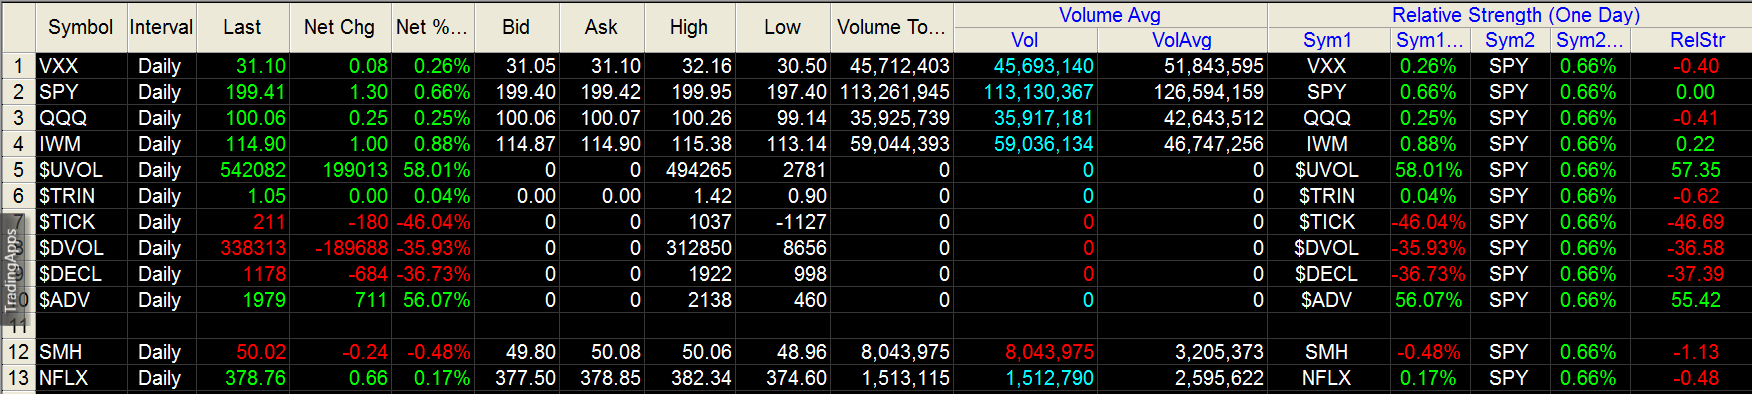
| Figure 2. Relative Performance. SMH substantially underperformed the SPY and QQQ during the trading session on October 30, 2014. |
| Graphic provided by: TradeStation. |
| Graphic provided by: TradeStation RadarScreen. |
| |
| The timing of trades by way of swing ratios, price cycles, and money flows can be an effective trading strategy (as are many others), but the real key to success with any methodology is a trader's ability to keep trade sizes small enough to avoid causing major damage to the trading capital in his/her account. The outcome of any trade is impossible to know, but what can be known — if a trader follows the rules for trade management — is how much trading capital is at risk at the onset. By keeping the inevitable losses small, when the big winning trades arrive the account value will still be able to grow. So, on this potential trade in SMH you'd want to limit your account risk to 1 or 2% maximum, use a fairly close stop loss (based on a key resistance level), and have a predetermined exit strategy for trailing a stop, setting profit targets or even the use of a time stop to get you out of a trade that isn't really doing much of anything. Trade wisely until we meet here again. |
Freelance financial markets writer and online publisher of the Trendzetterz.com S&P 500 Weekly Forecast service.
| Title: | Market consultant and writer |
| Company: | Trendzetterz |
| Address: | 81 Hickory Hollow Drive |
| Crossville, TN 38555 | |
| Phone # for sales: | 904-303-4814 |
| Website: | trendzetterz.com |
| E-mail address: | support@trendzetterz.com |
Traders' Resource Links | |
| Trendzetterz has not added any product or service information to TRADERS' RESOURCE. | |
Click here for more information about our publications!
PRINT THIS ARTICLE

Request Information From Our Sponsors
- StockCharts.com, Inc.
- Candle Patterns
- Candlestick Charting Explained
- Intermarket Technical Analysis
- John Murphy on Chart Analysis
- John Murphy's Chart Pattern Recognition
- John Murphy's Market Message
- MurphyExplainsMarketAnalysis-Intermarket Analysis
- MurphyExplainsMarketAnalysis-Visual Analysis
- StockCharts.com
- Technical Analysis of the Financial Markets
- The Visual Investor
- VectorVest, Inc.
- Executive Premier Workshop
- One-Day Options Course
- OptionsPro
- Retirement Income Workshop
- Sure-Fire Trading Systems (VectorVest, Inc.)
- Trading as a Business Workshop
- VectorVest 7 EOD
- VectorVest 7 RealTime/IntraDay
- VectorVest AutoTester
- VectorVest Educational Services
- VectorVest OnLine
- VectorVest Options Analyzer
- VectorVest ProGraphics v6.0
- VectorVest ProTrader 7
- VectorVest RealTime Derby Tool
- VectorVest Simulator
- VectorVest Variator
- VectorVest Watchdog