

HOT TOPICS LIST
- MACD
- Fibonacci
- RSI
- Gann
- ADXR
- Stochastics
- Volume
- Triangles
- Futures
- Cycles
- Volatility
- ZIGZAG
- MESA
- Retracement
- Aroon
INDICATORS LIST
LIST OF TOPICS
PRINT THIS ARTICLE
by Matt Blackman
From the time it first started trading back in June 2014, GoPro Inc (GPRO) seemed like it was on a course to the moon. But then this high-flier hit the ceiling. So what's next?
Position: N/A
Matt Blackman
Matt Blackman is a full-time technical and financial writer and trader. He produces corporate and financial newsletters, and assists clients in getting published in the mainstream media. He is the host of TradeSystemGuru.com. Matt has earned the Chartered Market Technician (CMT) designation. Find out what stocks and futures Matt is watching on Twitter at www.twitter.com/RatioTrade
PRINT THIS ARTICLE
HEAD & SHOULDERS
GoPro Flashes The Bear
10/30/14 04:01:32 PMby Matt Blackman
From the time it first started trading back in June 2014, GoPro Inc (GPRO) seemed like it was on a course to the moon. But then this high-flier hit the ceiling. So what's next?
Position: N/A
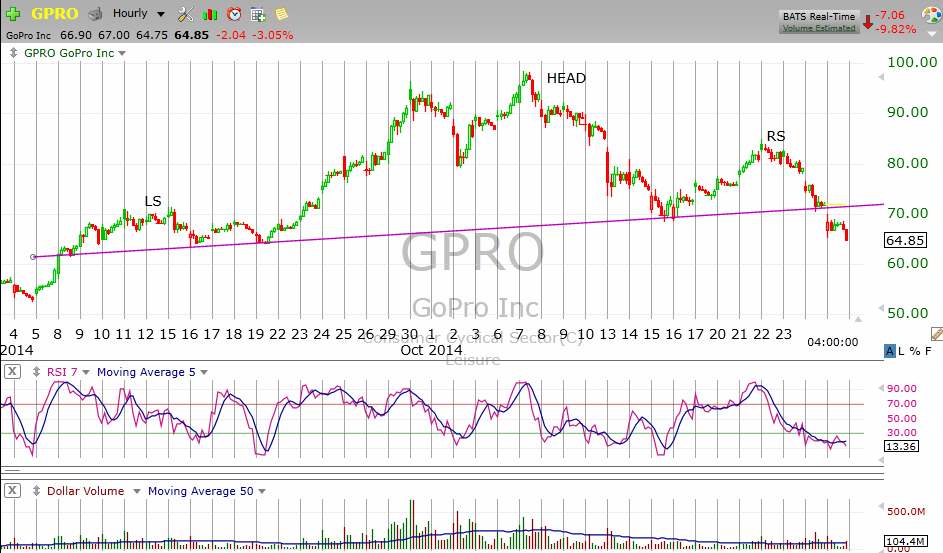
| On October 27, shares of camera-maker GoPro Inc. (GPRO) got hammered and in the process decisively breached the neckline of a bearish head & shoulders (H&S) pattern. The more than 9% one-day drop in GPRO occurred after it was reported that injuries suffered by Formula 1 race car driver Michael Schumacher in a ski accident may have been worsened because he was wearing one of the company's cameras mounted on his ski helmet (see link). |
|
| Figure 1. Hourly Chart Of GPRO. Here you see a clear head & shoulders patternwith an upward sloping neckline and gap down through it on October 27, 2014. |
| Graphic provided by: TC2000.com. |
| |
| GPRO began trading on June 26, 2014 opening at $28.65 to soar more than 300% before almost breaking the century mark on October 7, 2014. But technical traders were warned well ahead of the decline that something was amiss with the stock. As the hourly chart in Figure 1 shows, the H&S pattern began to build less than three months after the company started trading. According to TC2000.com, the company lost $0.24 in its latest quarter and even after the drop, was still trading at a sky-high price-to-book ratio of 191.79. |
|
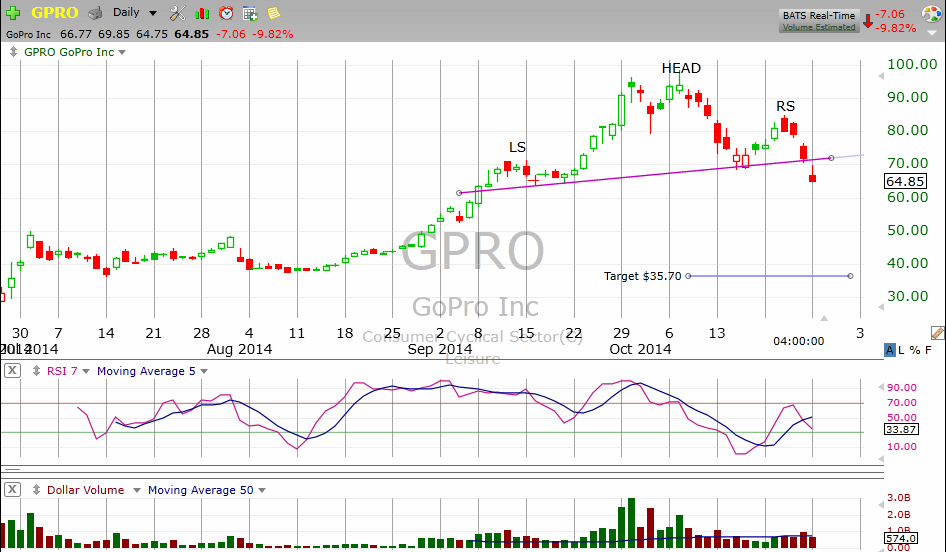
| Figure 2. Daily Chart Of GPRO. Here you see the stock chart of GPRO since it began trading. The relative strength index (RSI) shows there was a negative divergence with the price when it started heading into the H&S formation. |
| Graphic provided by: TC2000.com. |
| |
| The relative strength index (RSI) in the middle subgraph in Figure 2 shows there was negative divergence with GPRO which started ahead of the formation of the H&S head. GPRO subsequently mounted a weak rally accompanied by the RSI, which soon reversed before it reached the 70 overbought threshold. GPRO had just enough momentum to build a right shoulder before the stock rolled over and pierced the neckline. |
| This chart and chart pattern clearly shows that technicians had turned bearish on the stock long before the bad news hit and they didn't have to read the paper to know when to exit! |
| Look for GPRO to potentially mount a weak rally and if it fails to break back above the neckline on greater than average buying volume, will have the potential to be a good short trade. The minimum projected price target for the H&S pattern would take the stock almost back to $35.70, which is below where it traded on June 27, 2014. All bearish bets are off, however, if the neckline is broken on the next rally. |
Matt Blackman is a full-time technical and financial writer and trader. He produces corporate and financial newsletters, and assists clients in getting published in the mainstream media. He is the host of TradeSystemGuru.com. Matt has earned the Chartered Market Technician (CMT) designation. Find out what stocks and futures Matt is watching on Twitter at www.twitter.com/RatioTrade
| Company: | TradeSystemGuru.com |
| Address: | Box 2589 |
| Garibaldi Highlands, BC Canada | |
| Phone # for sales: | 604-898-9069 |
| Fax: | 604-898-9069 |
| Website: | www.tradesystemguru.com |
| E-mail address: | indextradermb@gmail.com |
Traders' Resource Links | |
| TradeSystemGuru.com has not added any product or service information to TRADERS' RESOURCE. | |
Click here for more information about our publications!
PRINT THIS ARTICLE

Request Information From Our Sponsors
- StockCharts.com, Inc.
- Candle Patterns
- Candlestick Charting Explained
- Intermarket Technical Analysis
- John Murphy on Chart Analysis
- John Murphy's Chart Pattern Recognition
- John Murphy's Market Message
- MurphyExplainsMarketAnalysis-Intermarket Analysis
- MurphyExplainsMarketAnalysis-Visual Analysis
- StockCharts.com
- Technical Analysis of the Financial Markets
- The Visual Investor
- VectorVest, Inc.
- Executive Premier Workshop
- One-Day Options Course
- OptionsPro
- Retirement Income Workshop
- Sure-Fire Trading Systems (VectorVest, Inc.)
- Trading as a Business Workshop
- VectorVest 7 EOD
- VectorVest 7 RealTime/IntraDay
- VectorVest AutoTester
- VectorVest Educational Services
- VectorVest OnLine
- VectorVest Options Analyzer
- VectorVest ProGraphics v6.0
- VectorVest ProTrader 7
- VectorVest RealTime Derby Tool
- VectorVest Simulator
- VectorVest Variator
- VectorVest Watchdog