

HOT TOPICS LIST
- MACD
- Fibonacci
- RSI
- Gann
- ADXR
- Stochastics
- Volume
- Triangles
- Futures
- Cycles
- Volatility
- ZIGZAG
- MESA
- Retracement
- Aroon
INDICATORS LIST
LIST OF TOPICS
PRINT THIS ARTICLE
by Donald W. Pendergast, Jr.
Several days per month, day traders are treated to a 'trend day' in the S&P 500 index; here's how to recognize and profit from such events.
Position: N/A
Donald W. Pendergast, Jr.
Freelance financial markets writer and online publisher of the Trendzetterz.com S&P 500 Weekly Forecast service.
PRINT THIS ARTICLE
DAY TRADING
SPY: Identifying Trend Days
10/29/14 02:32:09 PMby Donald W. Pendergast, Jr.
Several days per month, day traders are treated to a 'trend day' in the S&P 500 index; here's how to recognize and profit from such events.
Position: N/A
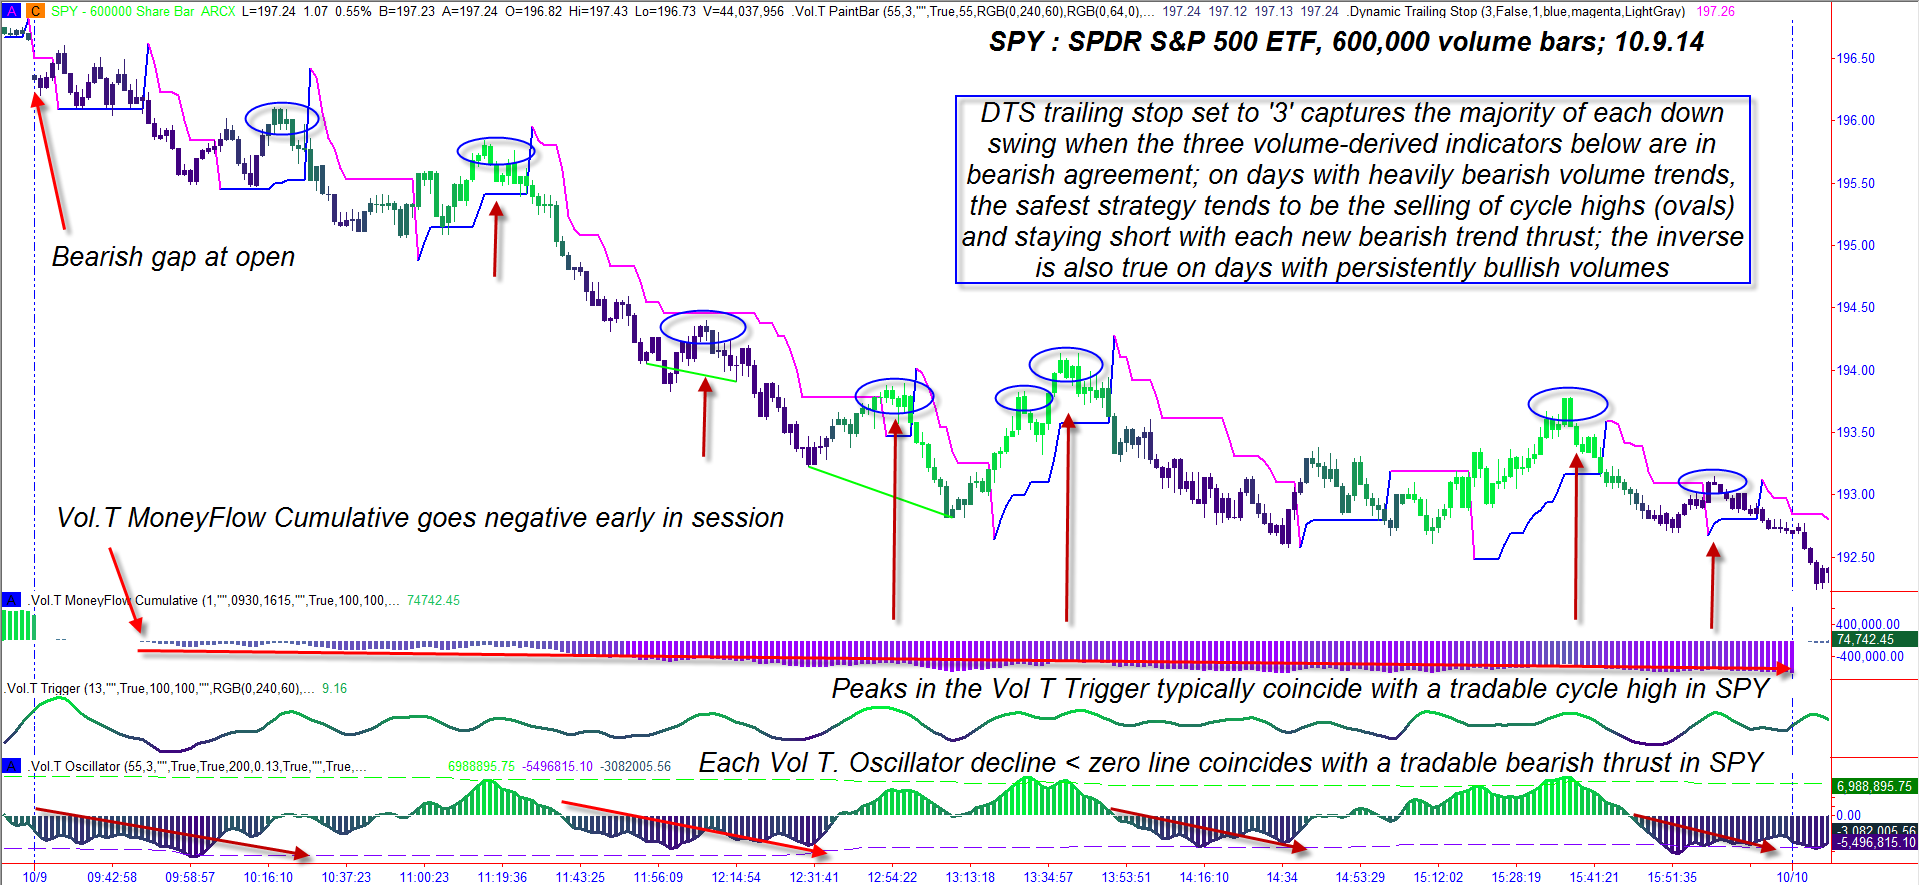
| Among the day trading crowd, the big stock indexes like the S&P 500 (.SPX. SPY) are regarded as stop & reverse kind of markets; this simply refers to the mean reversion bias of stock indexes, which can make them day trading/swing trading favorites. But once a week or so (sometimes less, sometimes more), the .SPX has an intraday session where the trading bias is bullish/bearish for most, if not all of the day, and it's at these times that day traders get to play the role of trend follower and make relatively 'easier' money with less effort. Here's a look at a recent trend day in SPY (SPDR S&P 500 ETF), using a 600,000 share bar chart set to the regular retail trading session hours (930-1600 ET) along with the key indicator volume signals to be aware of. |
|
| Figure 1. SPDR S&P 500 ETF (SPY): Trading in the direction of the primary trend — as defined by volume-derived indicators — is one way to ride the coattails of the so-called 'smart money' institutions who account for 80% of all daily trading activity. |
| Graphic provided by: TradeStation. |
| Graphic provided by: Elite Trader Indicators by Fibozachi.com. |
| |
| This intraday 600k volume candle chart of SPY in Figure 1 is from October 9, 2014 during the big decline that inaugurated on September 19, 2014; note the key technical dynamics at work that identify it as a trend day from the very onset of the session: 1. A bearish gap at the open (196.33) 2. At 9:35 am ET the Vol T Money Trend Cumulative histogram dropped below its zero line, staying below it for the entire session. This indicator measures the accumulated bearish/bullish money flow trend based on tick/volume data; nine times out of 10, trading in the same direction as money flow is a sound trading strategy 3. The Vol T Trigger, each time it dipped below its zero line, also confirmed strong bearish price thrusts in SPY 4. Yet another volume-based histogram — the Vol T Oscillator &mdas; also provided confirmation that being on the short side was the way to go with each new turn below its own zero line. 5. Finally, the standard deviation (derived DTS trailing stop blue/red lines) provided a means of risk control, trend confirmation and trade management; declines below the trailing stop also coincided with sustained bearish swings on several occasions. Note the brief retracement moves against the down trend (ovals); in almost every case the lower two oscillator peaks coincided with these rallies, helping highlight low-risk short selling zones as the session progressed. On examining similar volume indicators on persistently bullish trend days, the exact inverse patterns manifested; as with bearish trend days, once in a while the entire day is completely biased to one direction or the other, while at others you may see a bullish morning session and a bearish afternoon session and vice-versa. The bottom line is this, and it truly applies to any kind of valid trading method: A. Trade in the direction of the primary trend B. Sell short pullbacks in bearish trends C. Buy pullbacks in bullish trends D. Never trade countertrend except at high-probability trend reversal zones |
|
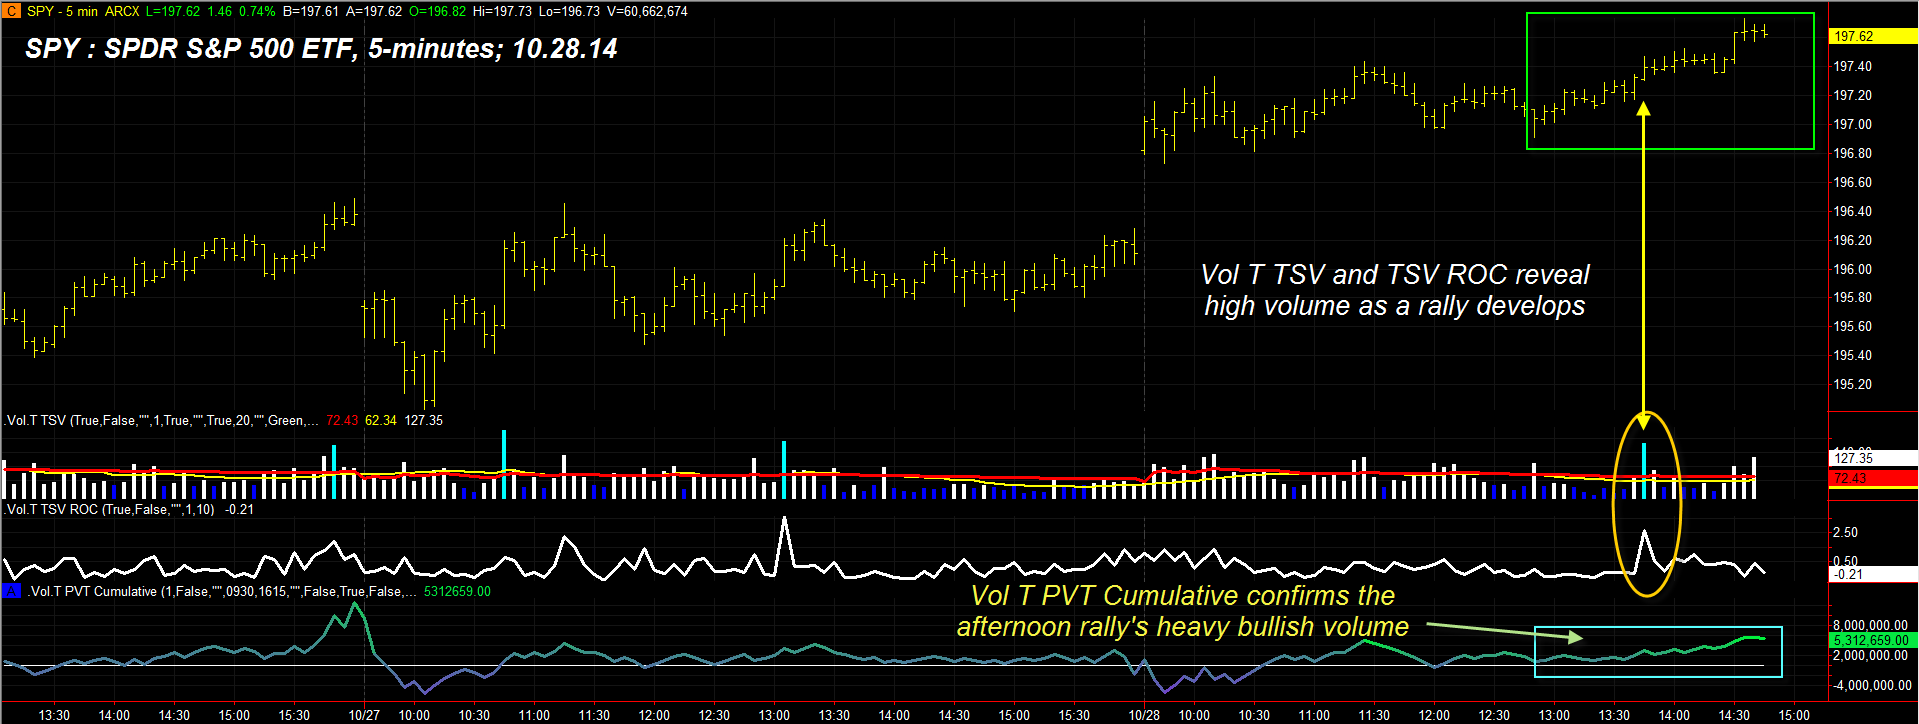
| Figure 2. Note the sharp spike in trading volume just as the late afternoon rally in SPY got underway; once again, trading in the direction of primary trend and money flow are key elements in achieving long-term trading success. |
| Graphic provided by: TradeStation. |
| Graphic provided by: Elite Trader Indicators by Fibozachi.com. |
| |
| Most professional traders will agree at the veracity of those assertions; in fact, they generally make a nice living taking the money from the pockets of novice traders who are foolish enough to trade in defiance to those tried and true market truths. The chart in Figure 2 appears to make the case very plainly — always trade with the trend, making sure the volume patterns are in strong agreement with the price action of the instrument on the chart. Trade wisely until we meet here again. |
Freelance financial markets writer and online publisher of the Trendzetterz.com S&P 500 Weekly Forecast service.
| Title: | Market consultant and writer |
| Company: | Trendzetterz |
| Address: | 81 Hickory Hollow Drive |
| Crossville, TN 38555 | |
| Phone # for sales: | 904-303-4814 |
| Website: | trendzetterz.com |
| E-mail address: | support@trendzetterz.com |
Traders' Resource Links | |
| Trendzetterz has not added any product or service information to TRADERS' RESOURCE. | |
Click here for more information about our publications!
PRINT THIS ARTICLE

Request Information From Our Sponsors
- StockCharts.com, Inc.
- Candle Patterns
- Candlestick Charting Explained
- Intermarket Technical Analysis
- John Murphy on Chart Analysis
- John Murphy's Chart Pattern Recognition
- John Murphy's Market Message
- MurphyExplainsMarketAnalysis-Intermarket Analysis
- MurphyExplainsMarketAnalysis-Visual Analysis
- StockCharts.com
- Technical Analysis of the Financial Markets
- The Visual Investor
- VectorVest, Inc.
- Executive Premier Workshop
- One-Day Options Course
- OptionsPro
- Retirement Income Workshop
- Sure-Fire Trading Systems (VectorVest, Inc.)
- Trading as a Business Workshop
- VectorVest 7 EOD
- VectorVest 7 RealTime/IntraDay
- VectorVest AutoTester
- VectorVest Educational Services
- VectorVest OnLine
- VectorVest Options Analyzer
- VectorVest ProGraphics v6.0
- VectorVest ProTrader 7
- VectorVest RealTime Derby Tool
- VectorVest Simulator
- VectorVest Variator
- VectorVest Watchdog