HOT TOPICS LIST
- MACD
- Fibonacci
- RSI
- Gann
- ADXR
- Stochastics
- Volume
- Triangles
- Futures
- Cycles
- Volatility
- ZIGZAG
- MESA
- Retracement
- Aroon
INDICATORS LIST
LIST OF TOPICS
PRINT THIS ARTICLE
by Koos van der Merwe
When you look at reports on this company's shares, various analysts suggest that it is a strong buy. Is it?
Position: Accumulate
Koos van der Merwe
Has been a technical analyst since 1969, and has worked as a futures and options trader with First Financial Futures in Johannesburg, South Africa.
PRINT THIS ARTICLE
ELLIOTT WAVE
CenturyLink, Inc.
10/29/14 02:25:35 PMby Koos van der Merwe
When you look at reports on this company's shares, various analysts suggest that it is a strong buy. Is it?
Position: Accumulate
| CenturyLink, Inc. (CTL) is the third largest telecommunications company in the United States and is recognized as a leader in the network services market by technology industry analyst firms. The company is a global leader in cloud infrastructure and hosted IT solutions for enterprise customers. They provide data, voice, and managed services in local, national, and select international markets through their advanced fiber optic network and multiple data centers for businesses and consumers. Quite a number of analysts are suggesting that the share is a buy, even at the current price. What do the charts say? |

|
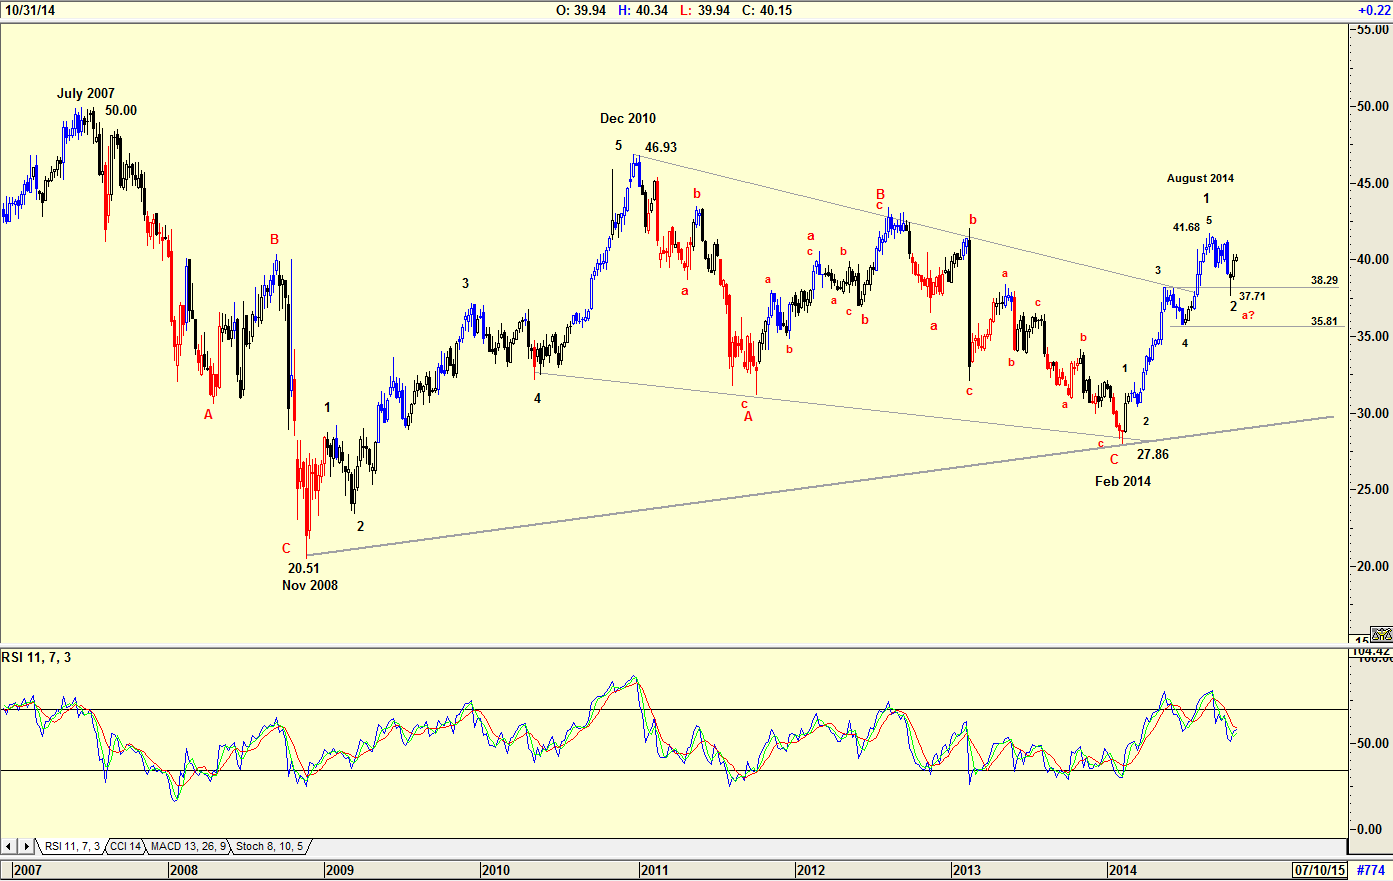
| Figure 1. Weekly Chart Of CenturyLink, Inc. (CTL). Here you see how the share price frll from a high of $50.00 in July 2007 to a low of $20.51 by November 2008. |
| Graphic provided by: AdvancedGET. |
| |
| The chart in Figure 1 is a weekly chart showing how the share price fell from a high of $50.00 in July 2007 to a low of $20.51 by November 2008. From that date the share price rose to $46.93 by December 2010 in an Elliott 5-wave rise. From there it fell in an ABC correction to a low of $27.86 by February 2014. The share then rose in 5 waves to $41.68 by August 2014. The share then corrected in a Wave 2 to $37.71, the 4th Wave of lesser degree. This means that the share could start rising into a Wave 3. However, the relative strength indicator (RSI) is showing further weakness ahead, suggesting that the fall to $37.71 could be a wave a in an abc correction. With wave 1 and wave 2 being a simple correction, wave 4 should be a complicated correction, so this is very possible. |

|
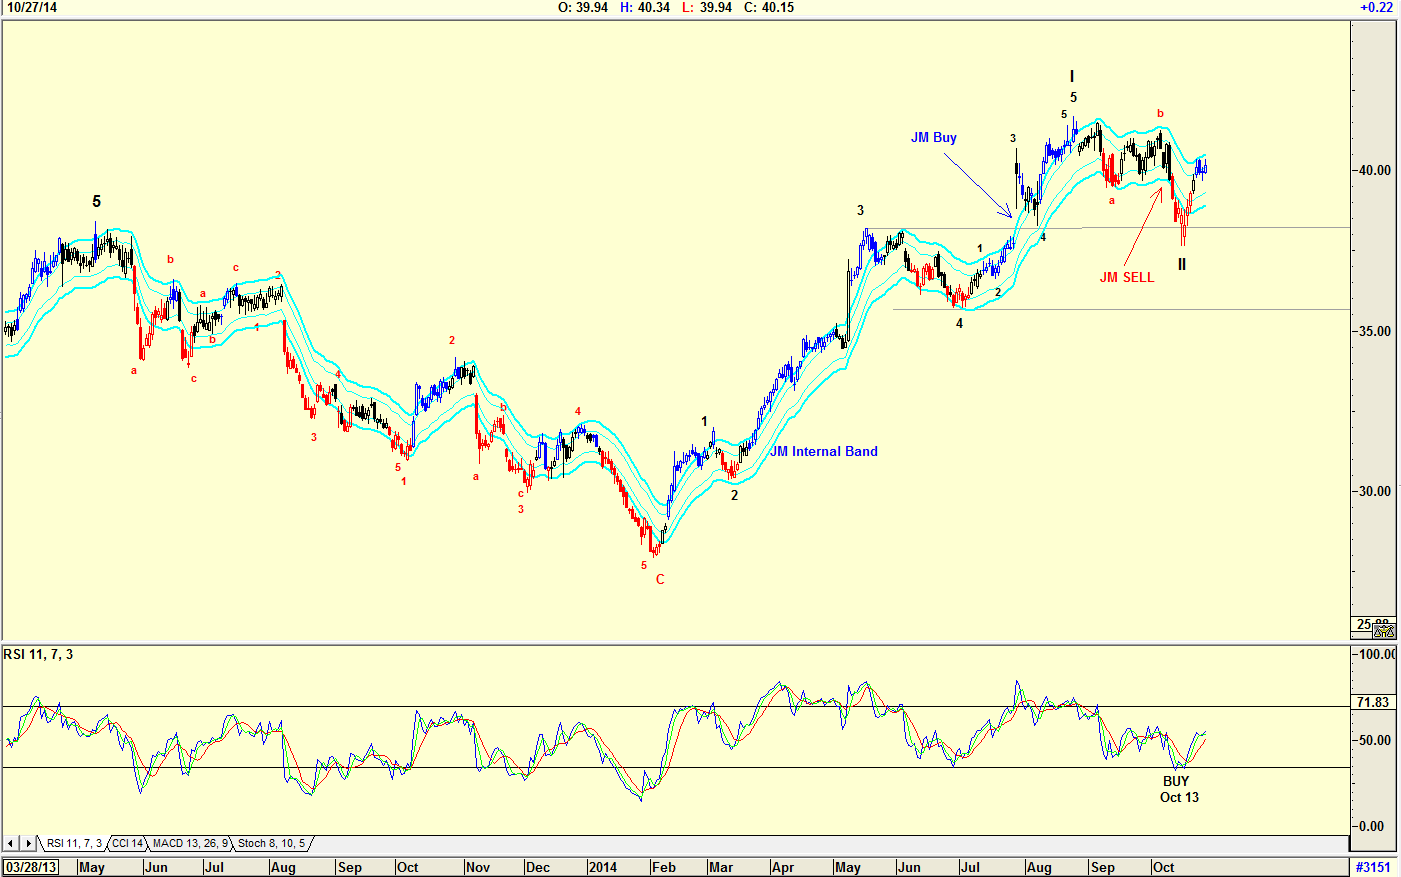
| Figure 2. Daily Chart Of CTL With Elliott Wave Count And JM Internal Band. The Elliott Wave count on the daily chart confirms an up move. |
| Graphic provided by: AdvancedGET. |
| |
| An Elliott Wave count of the daily chart in Figure 2, confirms that the share price is moving into a WAVE III upwards. The RSI is also in a buy trend having suggested a buy on October 13, 2014. Note that the share price is still below the upper JM Internal Band line, and has not given a buy signal. A JM Internal band is a 15-period simple moving average offset by 2% positive and 2% negative. A move above the upper band suggests a buy signal. The share price looks as though it will rise strongly over the next few months. However, you should never forget that an Elliott Wave count is simply a signpost in the wilderness and can change at a new signpost just down the road. Traders could buy the share based on the RSI buy signal, but investors should wait for a move above the upper JM Internal Band. |
Has been a technical analyst since 1969, and has worked as a futures and options trader with First Financial Futures in Johannesburg, South Africa.
| Address: | 3256 West 24th Ave |
| Vancouver, BC | |
| Phone # for sales: | 6042634214 |
| E-mail address: | petroosp@gmail.com |
Click here for more information about our publications!
Comments
Date: 10/29/14Rank: 1Comment: low graphic quality. Not possible to see details in the charts :-(

Request Information From Our Sponsors
- VectorVest, Inc.
- Executive Premier Workshop
- One-Day Options Course
- OptionsPro
- Retirement Income Workshop
- Sure-Fire Trading Systems (VectorVest, Inc.)
- Trading as a Business Workshop
- VectorVest 7 EOD
- VectorVest 7 RealTime/IntraDay
- VectorVest AutoTester
- VectorVest Educational Services
- VectorVest OnLine
- VectorVest Options Analyzer
- VectorVest ProGraphics v6.0
- VectorVest ProTrader 7
- VectorVest RealTime Derby Tool
- VectorVest Simulator
- VectorVest Variator
- VectorVest Watchdog
- StockCharts.com, Inc.
- Candle Patterns
- Candlestick Charting Explained
- Intermarket Technical Analysis
- John Murphy on Chart Analysis
- John Murphy's Chart Pattern Recognition
- John Murphy's Market Message
- MurphyExplainsMarketAnalysis-Intermarket Analysis
- MurphyExplainsMarketAnalysis-Visual Analysis
- StockCharts.com
- Technical Analysis of the Financial Markets
- The Visual Investor
