HOT TOPICS LIST
- MACD
- Fibonacci
- RSI
- Gann
- ADXR
- Stochastics
- Volume
- Triangles
- Futures
- Cycles
- Volatility
- ZIGZAG
- MESA
- Retracement
- Aroon
INDICATORS LIST
LIST OF TOPICS
PRINT THIS ARTICLE
by Gary Grosschadl
Two patterns have emerged on Procter & Gamble's weekly chart: A large triangle and a potentially bearish rising wedge.
Position: N/A
Gary Grosschadl
Independent Canadian equities trader and technical analyst based in Peterborough
Ontario, Canada.
PRINT THIS ARTICLE
CHART ANALYSIS
Procter & Gamble's Weekly Chart Has Challenges
11/01/02 10:40:09 AMby Gary Grosschadl
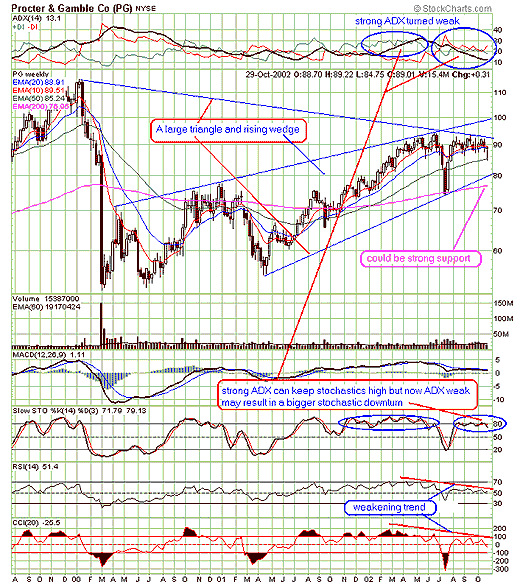
Two patterns have emerged on Procter & Gamble's weekly chart: A large triangle and a potentially bearish rising wedge.
Position: N/A
| Checking the daily chart shows a sideways trading range above the 200-period exponential moving average (EMA). To gather more clues, look at the bigger, longer term picture via the weekly chart. |
| The large triangle is a neutral pattern which bears watching on a break on large volume either way. It should be noted that a downside break of the triangle leads to close proximity of the important 200-period EMA. Traders should watch that line carefully as shorting the stock prematurely could result in a quick bounce off this moving average. So the real test will be that line. Look there for direction when the time comes. This also applies to the other pattern - the bearish rising wedge. |

|
| Graphic provided by: stockcharts.com. |
| |
| If there is a topside move past the triangle, then two resistance zones come into play. First, the rising wedge trendline which also marks previous congestion at $100 and then the previous high zone around $115. |
| Based on the displayed indicators, I am leaning towards a downside move to test those lower support lines. Looking at the trend strength indicator (ADX) at the top of the chart, note how trend strength has switched from strong to weak. This is also reflected on the RSI and CCI indicators. A further interesting observation can be gleaned from the stochastics indicator. In strong trending markets, oscillators can "stick" in overbought territory often making them unreliable. The pattern here is a perfect example. Stochastics stuck high while the ADX was strong and rising. But now we have quite a different situation. ADX has fallen steeply and is now weak, showing poor trend strength. This is a clue that oscillators should ring true again...in other words, a stochastic downturn should signal ongoing and coming price weakness. |
| In my opinion, the weekly chart shows that dangers lie ahead. Watch for any downside move as this will likely lead to testing the $76 - $80 support lines mentioned previously. If that support test fails, shorters may move in for the kill. Aggressive shorter term traders may decide to short earlier anticipating these possible tests but the risk level is higher. |
Independent Canadian equities trader and technical analyst based in Peterborough
Ontario, Canada.
| Website: | www.whatsonsale.ca/financial.html |
| E-mail address: | gwg7@sympatico.ca |
Click here for more information about our publications!
PRINT THIS ARTICLE

Request Information From Our Sponsors
- VectorVest, Inc.
- Executive Premier Workshop
- One-Day Options Course
- OptionsPro
- Retirement Income Workshop
- Sure-Fire Trading Systems (VectorVest, Inc.)
- Trading as a Business Workshop
- VectorVest 7 EOD
- VectorVest 7 RealTime/IntraDay
- VectorVest AutoTester
- VectorVest Educational Services
- VectorVest OnLine
- VectorVest Options Analyzer
- VectorVest ProGraphics v6.0
- VectorVest ProTrader 7
- VectorVest RealTime Derby Tool
- VectorVest Simulator
- VectorVest Variator
- VectorVest Watchdog
- StockCharts.com, Inc.
- Candle Patterns
- Candlestick Charting Explained
- Intermarket Technical Analysis
- John Murphy on Chart Analysis
- John Murphy's Chart Pattern Recognition
- John Murphy's Market Message
- MurphyExplainsMarketAnalysis-Intermarket Analysis
- MurphyExplainsMarketAnalysis-Visual Analysis
- StockCharts.com
- Technical Analysis of the Financial Markets
- The Visual Investor
