HOT TOPICS LIST
- MACD
- Fibonacci
- RSI
- Gann
- ADXR
- Stochastics
- Volume
- Triangles
- Futures
- Cycles
- Volatility
- ZIGZAG
- MESA
- Retracement
- Aroon
INDICATORS LIST
LIST OF TOPICS
PRINT THIS ARTICLE
by Koos van der Merwe
On October 28, 2014 at 8:30 a.m. (EDT), Coach, Inc. (COH) held a conference call to discuss the company's first quarter results.
Position: Buy
Koos van der Merwe
Has been a technical analyst since 1969, and has worked as a futures and options trader with First Financial Futures in Johannesburg, South Africa.
PRINT THIS ARTICLE
TECHNICAL ANALYSIS
Coach, A Share To Watch
10/29/14 02:20:55 PMby Koos van der Merwe
On October 28, 2014 at 8:30 a.m. (EDT), Coach, Inc. (COH) held a conference call to discuss the company's first quarter results.
Position: Buy
| The question of course is, do you anticipate a positive result, and should you buy the share ahead of the results? This is a gamble any trader or investor takes. Traders and investors in the market could push up the share price, giving technical analysis positive buy signals on the charts, something we saw recently with Amazon, Inc. (AMZN) where the indicators were all bullish ahead of the results. When announced, the results were very negative, resulting in a 23% fall in price. Any immediate rise is the result of short sellers taking profits. So do you buy shares in Coach (COH) or do you sit on the sidelines and wait? |

|
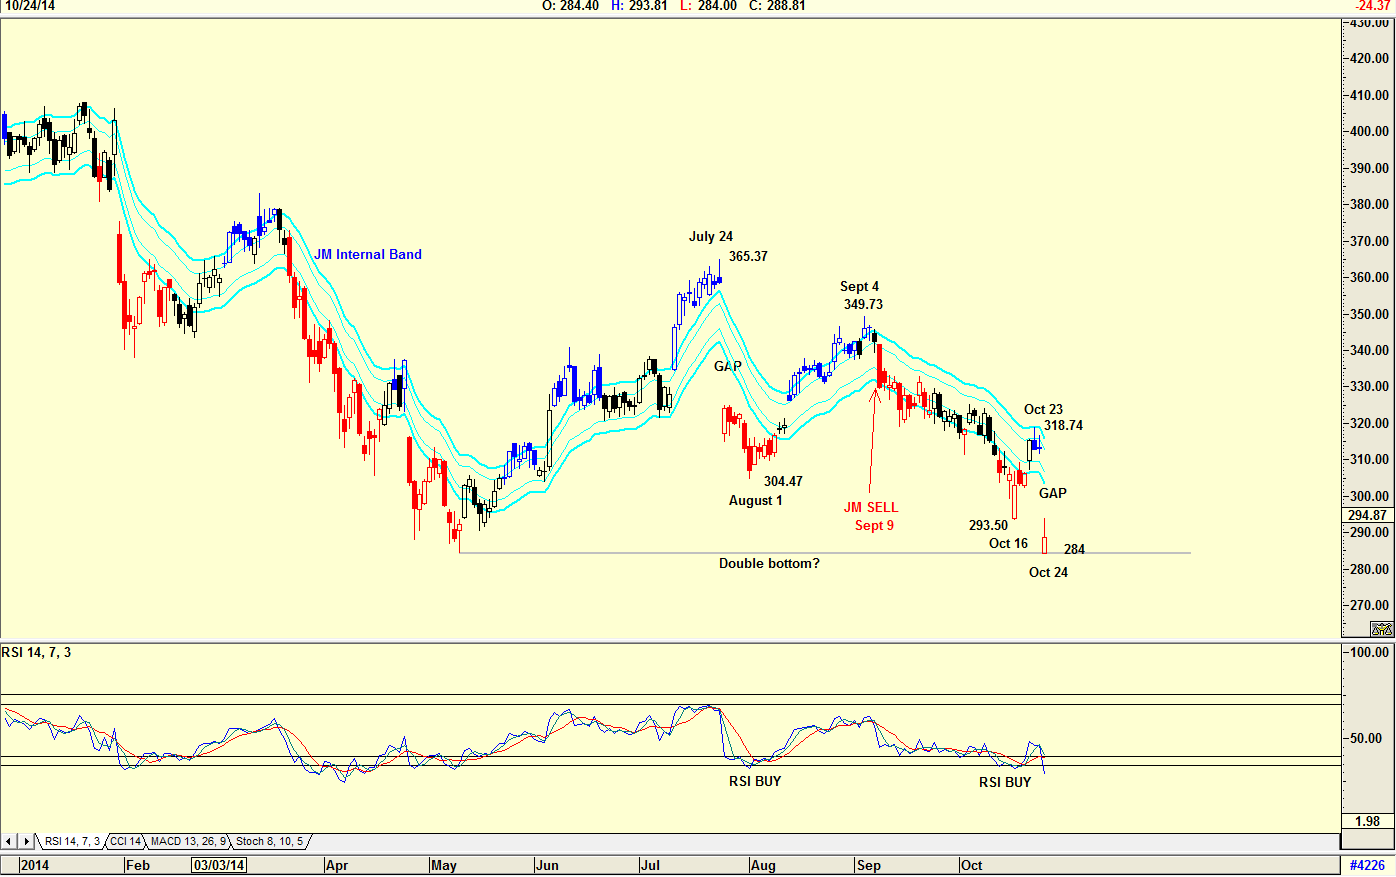
| Figure 1. Daily Chart Of Amazon, Inc. (AMZN). When the company issued poor results, the stock price fell from a high of $365.37 to a low of $304.47. |
| Graphic provided by: AdvancedGET. |
| |
| The chart in Figure 1 is a chart of AMZN. The chart shows how the price fell strongly from a high of $365.37 on July 24, 2014 to a low of $304.47, a result of poor economic results issued by the company. Of course the share will rise to fill the gap, which it did, rising to $349.73 by September 4, 2014. The share then started falling giving a JM Internal Band sell signal on September 9, 2014. A JM Internal Band is a 15-period simple moving average offset by 2% positive and 2% negative. A buy signal is given when the share price breaks above the upper band, and a sell signal when the price falls below the lower band. Note the JM sell signal given on September 9, 2014 with the share price falling to $293.50 by October 16, 2014. With the RSI suggesting a buy on October 16, 2014 traders probably started buying pushing the share price up to $318.74 by October 23, 2014 in anticipation of quarterly results. The results when announced were once again disappointing, and the share price fell on a gap on October 24, 2014 to $284. Of course the expectation now is that the share price should rise to fill the gap, and with the double bottom that has formed, the possibility of a rise is strengthened. |

|
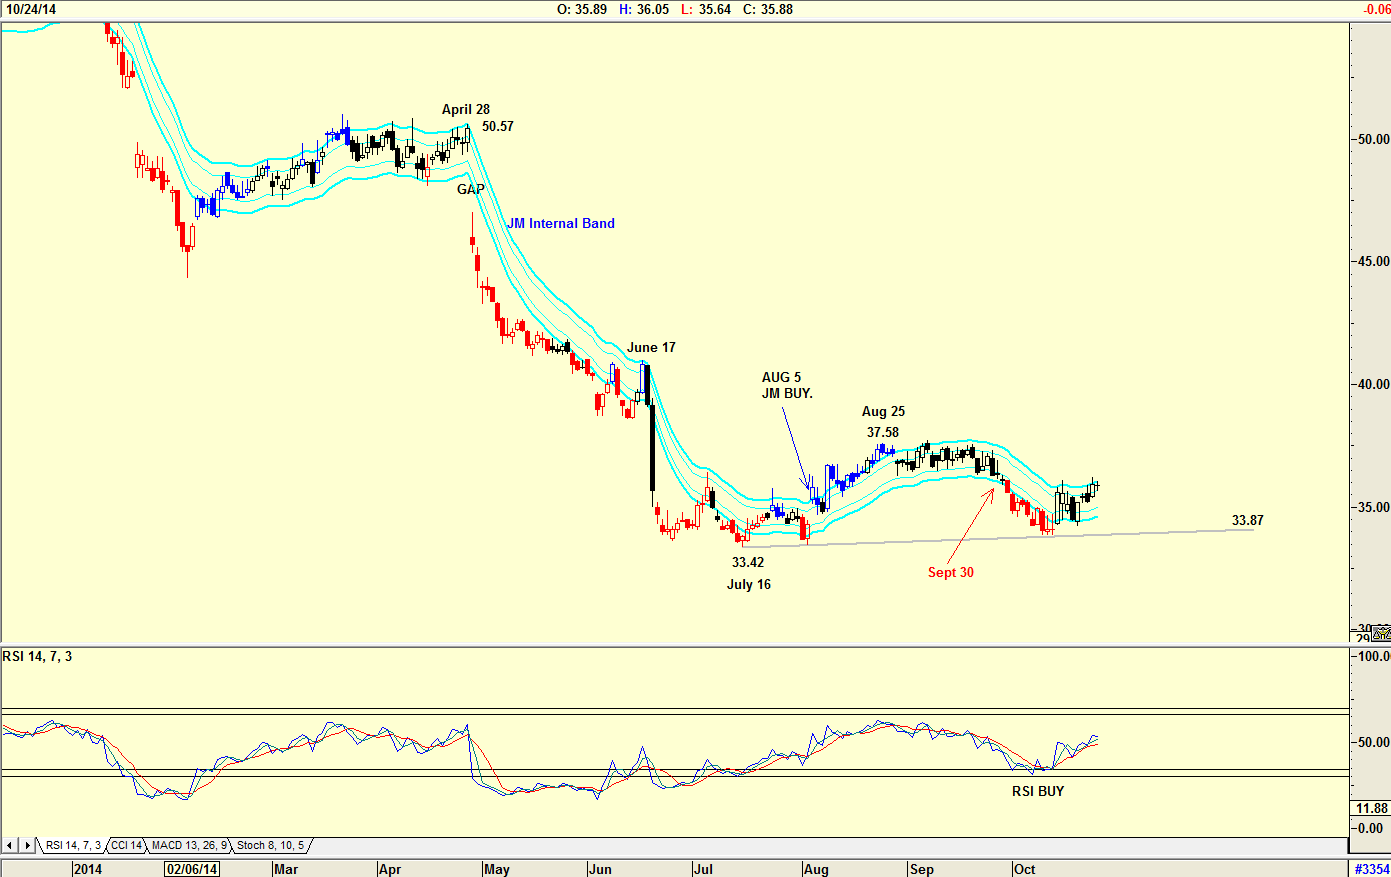
| Figure 2. Daily Chart of Coach (COH). The relative strength index (RSI) is suggesting a buy, prices have formed a double bottom, and the price is testing the upper internal band. Should you have bought the stock ahead of its quarterly report? |
| Graphic provided by: AdvancedGET. |
| |
| Looking at the chart of COH shares in Figure 2, you see the following: A share price that fell on a gap on April 28, 2014 and another strong fall on June 17, 2014 to a low of $33.42 by July 16, 2014. On August 4, 2014 Forbes issued a report — "As a result of declining sales, Coach decided to close as many as 70 stores in North America, resulting in a 13% decline in its North America store count....Coach aims to grow aggressively in Europe as it plans to open 70 wholesale and 10 retail stores across the region during the fiscal year. Coach also intends to enhance its distributor-run business in Latin America, other Asia-Pacific countries (Australia, Thailand and Indonesia), and in the Middle East. As a result, we believe the proportion of international sales in Coach's overall sales will rise in the future." With the quarterly report out on August 5, 2014 the share gave a JM Internal Band buy signal and rose to $37.58 by August 25, 2014 before starting to fall once again, giving a JM Internal band sell signal on September 30, 2014. The question now is with the RSI suggesting a buy, with the double bottom that has formed, and with the share price testing the upper internal band, should you have bought the stock ahead of its quarterly report on October 28, 2014? The chart of AMZN in Figure 1 suggested that you should not have. A trader, however, could take the gamble whereas an investor should wait. |
Has been a technical analyst since 1969, and has worked as a futures and options trader with First Financial Futures in Johannesburg, South Africa.
| Address: | 3256 West 24th Ave |
| Vancouver, BC | |
| Phone # for sales: | 6042634214 |
| E-mail address: | petroosp@gmail.com |
Click here for more information about our publications!
Comments

Request Information From Our Sponsors
- StockCharts.com, Inc.
- Candle Patterns
- Candlestick Charting Explained
- Intermarket Technical Analysis
- John Murphy on Chart Analysis
- John Murphy's Chart Pattern Recognition
- John Murphy's Market Message
- MurphyExplainsMarketAnalysis-Intermarket Analysis
- MurphyExplainsMarketAnalysis-Visual Analysis
- StockCharts.com
- Technical Analysis of the Financial Markets
- The Visual Investor
- VectorVest, Inc.
- Executive Premier Workshop
- One-Day Options Course
- OptionsPro
- Retirement Income Workshop
- Sure-Fire Trading Systems (VectorVest, Inc.)
- Trading as a Business Workshop
- VectorVest 7 EOD
- VectorVest 7 RealTime/IntraDay
- VectorVest AutoTester
- VectorVest Educational Services
- VectorVest OnLine
- VectorVest Options Analyzer
- VectorVest ProGraphics v6.0
- VectorVest ProTrader 7
- VectorVest RealTime Derby Tool
- VectorVest Simulator
- VectorVest Variator
- VectorVest Watchdog
