HOT TOPICS LIST
- MACD
- Fibonacci
- RSI
- Gann
- ADXR
- Stochastics
- Volume
- Triangles
- Futures
- Cycles
- Volatility
- ZIGZAG
- MESA
- Retracement
- Aroon
INDICATORS LIST
LIST OF TOPICS
PRINT THIS ARTICLE
by Donald W. Pendergast, Jr.
Shares of Southwest Airlines suddenly reverse after hitting a major supply zone.
Position: N/A
Donald W. Pendergast, Jr.
Freelance financial markets writer and online publisher of the Trendzetterz.com S&P 500 Weekly Forecast service.
PRINT THIS ARTICLE
VOLUME
LUV: Warning Of Decline Ahead?
10/28/14 05:40:37 PMby Donald W. Pendergast, Jr.
Shares of Southwest Airlines suddenly reverse after hitting a major supply zone.
Position: N/A
| The concept of support & resistance remains the most important of all technical trading dynamics, despite the ever-increasing role of automation, algorithms, and trading bots here in the 21st century. Here's a look at how historical trading volume data can help make it easier for traders to identify key support & resistance areas ahead of time. |

|
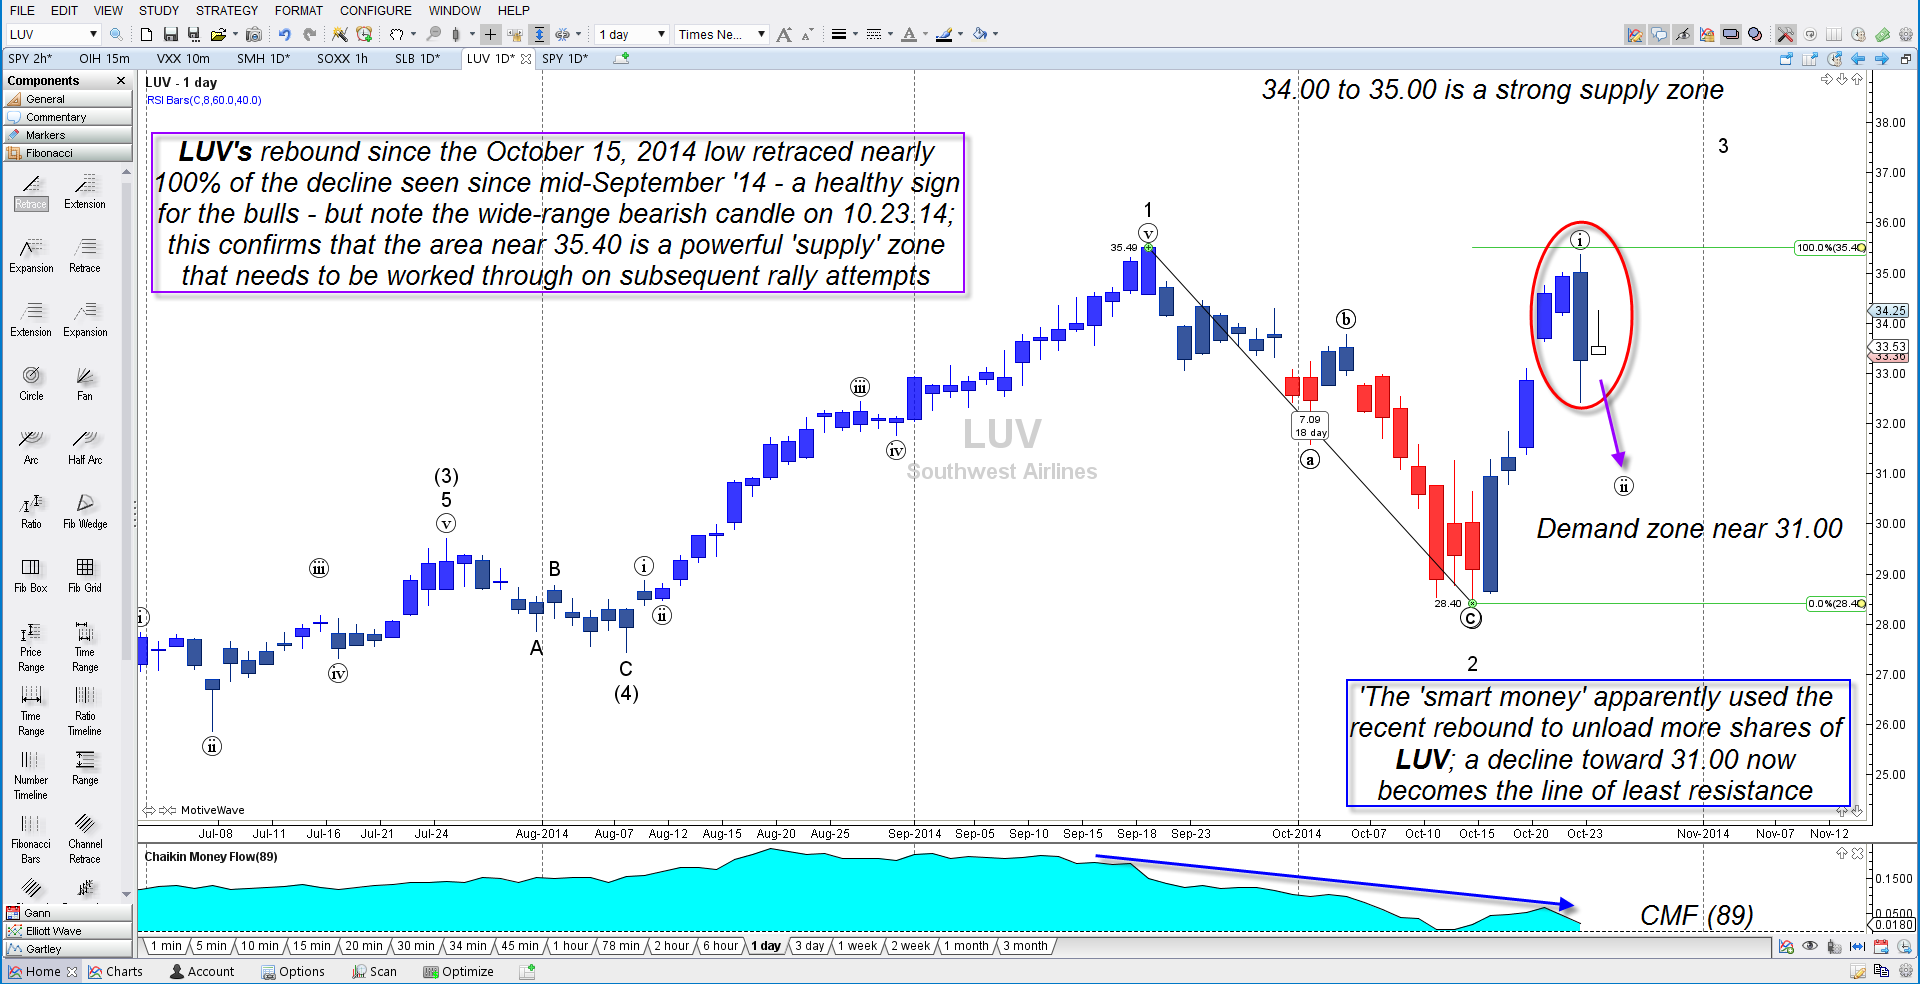
| Figure 1. Southwest Airlines (LUV): When a strong trend/swing move hits an area of heavy supply or demand, reversals can occur swiftly, as in the case of LUV on October 23, 2014 (red oval). |
| Graphic provided by: MotiveWave.com. |
| |
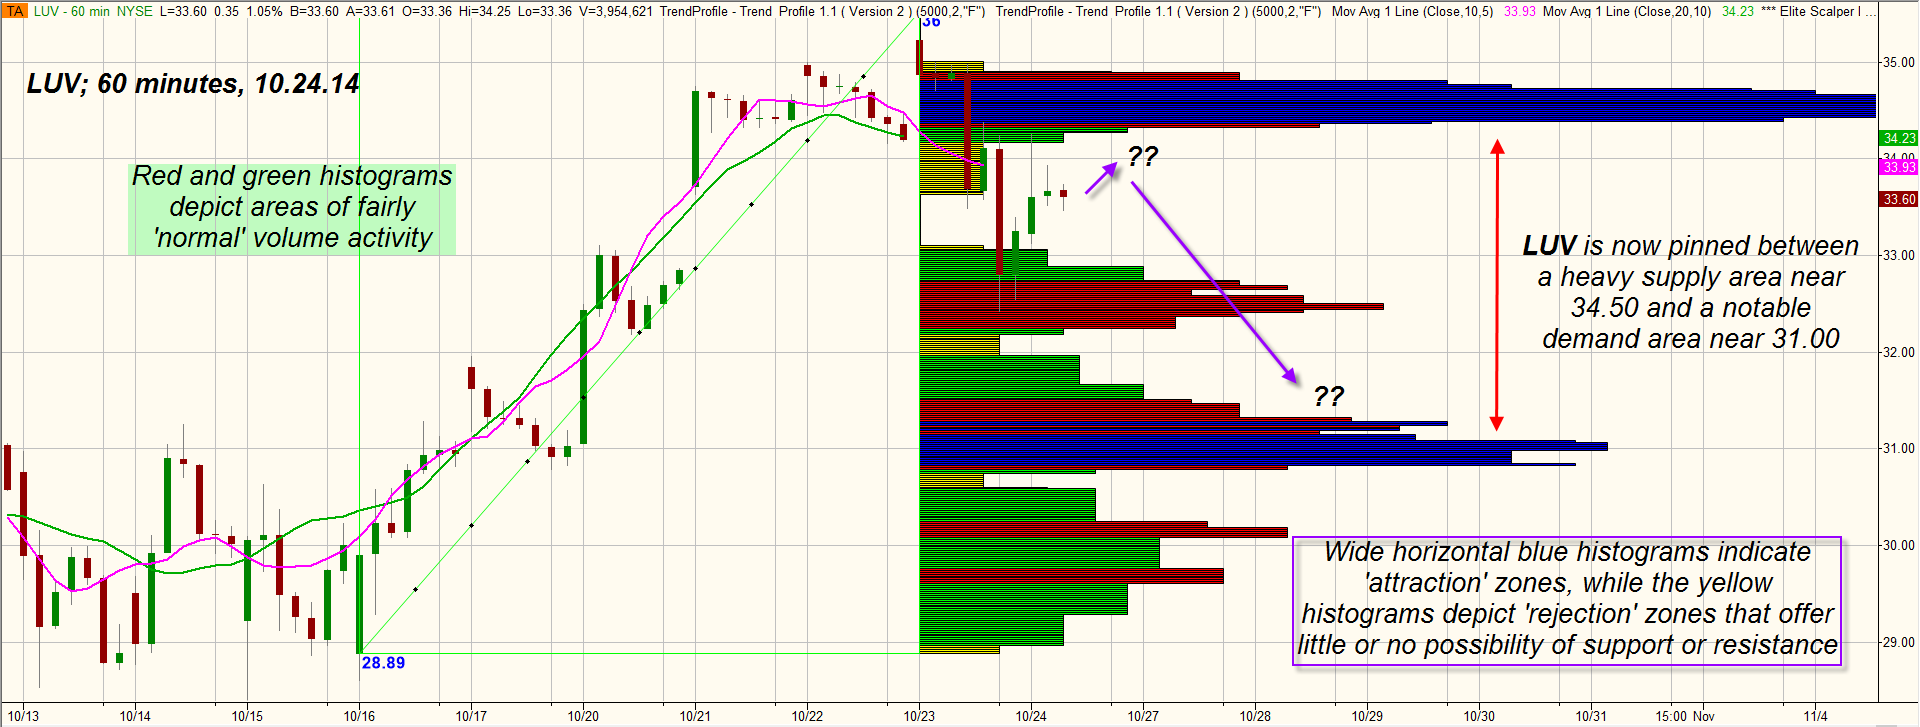
| Southwest Airlines (LUV) experienced a smooth and steady wave 5 rally between August 8-September 19, 2014 (Figure 1); the stock gained nearly 30% in that brief six-week span before plunging with the rest of the broad US markets. September 19, 2014 was one of those days in the markets when all industry groups and sectors got slammed, regardless of fundamentals, long-term outlooks, etc., and LUV got pulled down to the tune of 20% in only 19 trading sessions. As always, market sell-offs usually are 2-3 times more powerful than the rallies directly preceding them, and this was no exception; what was strange was how aggressively LUV recovered from the September/October rout in that it almost retook 100% of the losses incurred (surely this meant the bull was back in control in LUV shares — or did it?). Note how the stock made it to within 14 cents of the September 2014 high of 35.49 and then reversed sharply lower, closing the session at 33.25 (October 23, 2014). Why did a seemingly strong rally suddenly stop dead just pennies from a previous high, violently reversing lower as if a giant unseen hand had forced it down? There are two primary reasons and both of them are the result of prior trading volumes at specific price levels: 1. The 89-day Chaikin Money Flow (CMF)(89) made a much lower histogram high at the October 23, 2014 high than at the September 19, 2014 high, indicating that the "smart money" had used the rally from the October 15, 2014 lows as an opportunity to distribute their shares to market latecomer (amateur traders). 2. LUV's 60-minute chart reveals that when LUV rallied up past 35.00 that it hit a strong zone of supply (not shown), reached 35.35 and then quickly reversed lower, as confirmed by the wide range bearish hourly candles seen between 1200 and 1500 ET on October 23, 2014. Once prices stabilized, the Trend Profile (Figure 2) was updated and revealed that the 34.40-34.80 area was now a major supply zone, one that might be tough to exceed in the near future. Note also the strong demand zone down near 31.00; these long and wide horizontal blue histograms help give traders plenty of advance warning as to where a stock is most likely to meet with heavy buying or selling pressure and may be one of the most effective leading indicators available. |

|
| Figure 2. LUV's hourly Trend Profile chart depicts a stock caught between an area of heavy supply (above) and heavy demand (below). |
| Graphic provided by: Trend Profile by Trading-Algo.com. |
| |
| At the moment, LUV is mounting another small rally on its 60-minute chart and may or may not hit a new supply zone near 34.50; a strong rejection in or near that blue histogram sets up a high probability short trade setup, one with an outstanding risk-reward ratio of better than 3.5 to 1, using 31.00 as a nominal price target and 34.80 as an initial stop. You'll need a timing mechanism to get you in to the trade, so think that over before going short. Taking partial profits near the previous swing low at 33.41 would also be a great idea, locking in some gains should the trade move in your favor. Keep your risks small and remember to trade wisely until we meet here again. |
Freelance financial markets writer and online publisher of the Trendzetterz.com S&P 500 Weekly Forecast service.
| Title: | Market consultant and writer |
| Company: | Trendzetterz |
| Address: | 81 Hickory Hollow Drive |
| Crossville, TN 38555 | |
| Phone # for sales: | 904-303-4814 |
| Website: | trendzetterz.com |
| E-mail address: | support@trendzetterz.com |
Traders' Resource Links | |
| Trendzetterz has not added any product or service information to TRADERS' RESOURCE. | |
Click here for more information about our publications!
Comments

Request Information From Our Sponsors
- StockCharts.com, Inc.
- Candle Patterns
- Candlestick Charting Explained
- Intermarket Technical Analysis
- John Murphy on Chart Analysis
- John Murphy's Chart Pattern Recognition
- John Murphy's Market Message
- MurphyExplainsMarketAnalysis-Intermarket Analysis
- MurphyExplainsMarketAnalysis-Visual Analysis
- StockCharts.com
- Technical Analysis of the Financial Markets
- The Visual Investor
- VectorVest, Inc.
- Executive Premier Workshop
- One-Day Options Course
- OptionsPro
- Retirement Income Workshop
- Sure-Fire Trading Systems (VectorVest, Inc.)
- Trading as a Business Workshop
- VectorVest 7 EOD
- VectorVest 7 RealTime/IntraDay
- VectorVest AutoTester
- VectorVest Educational Services
- VectorVest OnLine
- VectorVest Options Analyzer
- VectorVest ProGraphics v6.0
- VectorVest ProTrader 7
- VectorVest RealTime Derby Tool
- VectorVest Simulator
- VectorVest Variator
- VectorVest Watchdog
