HOT TOPICS LIST
- MACD
- Fibonacci
- RSI
- Gann
- ADXR
- Stochastics
- Volume
- Triangles
- Futures
- Cycles
- Volatility
- ZIGZAG
- MESA
- Retracement
- Aroon
INDICATORS LIST
LIST OF TOPICS
PRINT THIS ARTICLE
by Donald W. Pendergast, Jr.
The Market Vectors Semiconductor ETF has rebounded from its strong September/October selloff, but signs of weakness still abound.
Position: N/A
Donald W. Pendergast, Jr.
Freelance financial markets writer and online publisher of the Trendzetterz.com S&P 500 Weekly Forecast service.
PRINT THIS ARTICLE
REVERSAL
SMH: Locating Exhaustion & Reversal Signals
10/24/14 04:54:06 PMby Donald W. Pendergast, Jr.
The Market Vectors Semiconductor ETF has rebounded from its strong September/October selloff, but signs of weakness still abound.
Position: N/A
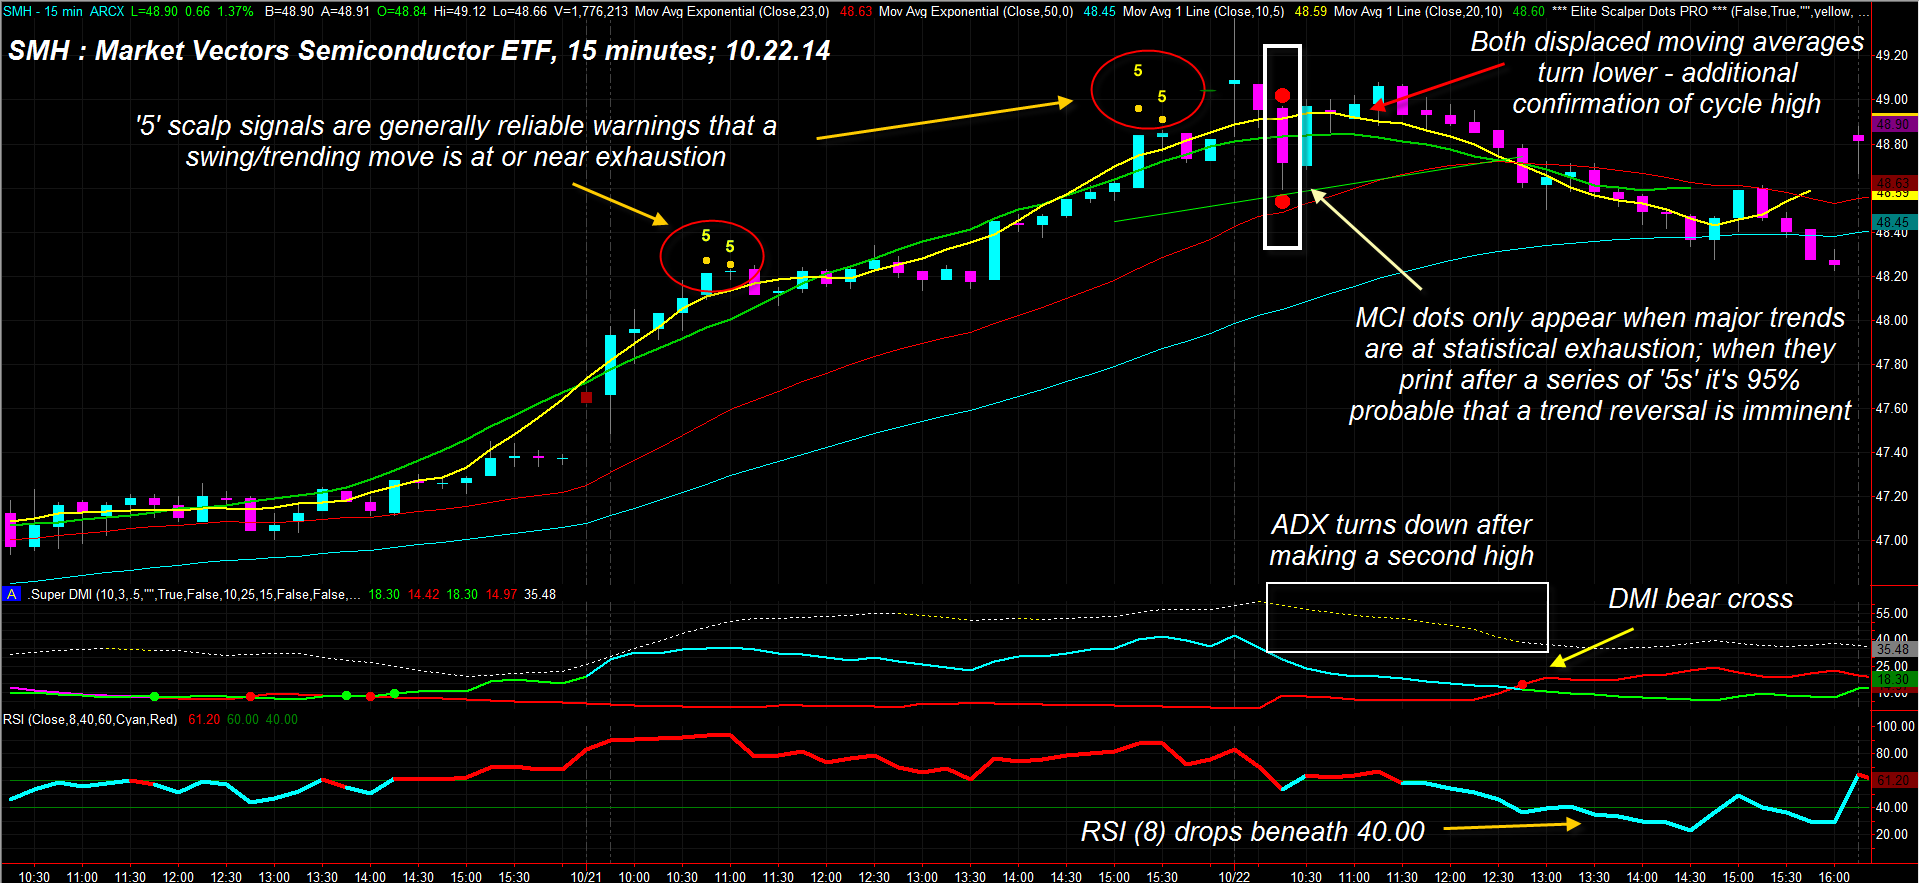
| Most stock industry groups have experienced relief rallies since bottoming on October 15 2014; here's how to identify when such rallies are beginning to fade before they reverse in a correction, using an intraday chart of a highly liquid industry group exchange-traded fund (Figure 1). |

|
| Figure 1. Market Vectors Semiconductor ETF (SMH): This 15-minute chart depicts a typical progression of trend exhaustion, trend termination, and trend reversal dynamics. |
| Graphic provided by: TradeStation. |
| Graphic provided by: Elite Trader Indicators by Fibozachi.com. |
| |
| The broad market decline from mid-September to mid-October 2014 may very well be the first installment of several more to come in late 2014 and in 2015, but for now most industry groups are enjoying a relief rally; the Market Vectors Semiconductor ETF (SMH) rose by 11.6% between October 15 and October 21, 2014 and is now in a 'wait and see' pattern, with the bulls and bears apparently undecided as to which direction the next tradable swing will go. During the final stage of the week-long rally from the lows, SMH gave numerous warning signals that its short-covering rally was approaching exhaustion and that existing longs needed to protect open gains, as follows: 1. Two sets of Elite Scalper Dots (two signals per set) printed; a consolidation occurred after the first pair, while full-blown reversal hit after the second pair appeared. 2. Shortly after the second pair of '5s' hit, the MCI dots showed up (red dots) two bars after the ultimate high of 49.37 was made. These are typically the 'last call' for existing longs to go to cash (and vice-versa for shorts to cover in downtrends) and are reliable trend reversal confirmation indicators after a series of '5s' have shown up on the chart. 3. Note that the ADX line turned lower after achieving a second high at the same time the MCI dots appeared and that the color of the line changed from white to yellow, indicating ADX trend exhaustion. 4. The two moving averages on the chart are the displaced variety; they both began to turn down as all of the above happened, thus providing evidence that a cycle high was already in place. 5. Next, the DMI made a bearish cross (red dot in DMI/ADX window), confirming the trend reversal. 6. Finally, the eight-period RSI dropped beneath 40.00 — and stayed beneath the 40.00 level — also confirming strong bearish momentum. So, in the indicator sequence, the sets of '5' signals gave advance warning of trend exhaustion, the MCI dots provided confirmation of trend termination, and the other four indicators supplied ample evidence of trend reversal. On most liquid stocks/ETFs and futures markets that tend to make tradable swing/trend moves, you'll see these kinds of patterns play out on a regular basis, and such indicators can help keep a trader on the 'right' side of a given market more often than not. Even better, if you see a developing trend exhaustion pattern that is close to a key support/resistance level, you have an additional, high-probability confirmation at your disposal. |

|
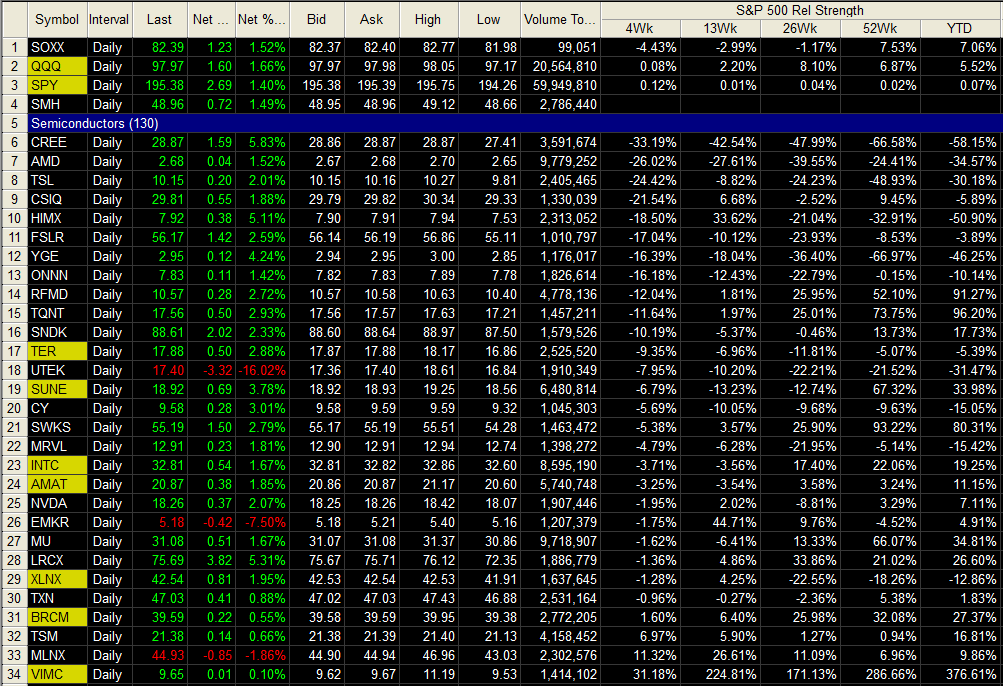
| Figure 2. Semiconductors vs. S&P 500. SMH, SOXX and most semiconductor issues rally on October 23, 2014; most all of these stocks are still under-performing the S&P 500 index (.SPX, SPY) over the past four weeks, however. |
| Graphic provided by: TradeStation. |
| Graphic provided by: TradeStation RadarScreen. |
| |
| Note that the identification/confirmation process avoids the dangers inherent in attempting to pick tops and bottoms, and simply allows the market in question to exhaust and then provide solid evidence of a valid reversal. Knowing the trend had already reversed could also have prevented the temptation to buy short-term pullbacks and encouraged traders to sell short-term rallies instead. There are many ways to use this kind of information, so play with such dynamics on the charts and time frames you normally trade and see if it helps provide you with more understanding of significant market dynamics. Trade wisely until we meet here again. |
Freelance financial markets writer and online publisher of the Trendzetterz.com S&P 500 Weekly Forecast service.
| Title: | Market consultant and writer |
| Company: | Trendzetterz |
| Address: | 81 Hickory Hollow Drive |
| Crossville, TN 38555 | |
| Phone # for sales: | 904-303-4814 |
| Website: | trendzetterz.com |
| E-mail address: | support@trendzetterz.com |
Traders' Resource Links | |
| Trendzetterz has not added any product or service information to TRADERS' RESOURCE. | |
Click here for more information about our publications!
PRINT THIS ARTICLE

Request Information From Our Sponsors
- VectorVest, Inc.
- Executive Premier Workshop
- One-Day Options Course
- OptionsPro
- Retirement Income Workshop
- Sure-Fire Trading Systems (VectorVest, Inc.)
- Trading as a Business Workshop
- VectorVest 7 EOD
- VectorVest 7 RealTime/IntraDay
- VectorVest AutoTester
- VectorVest Educational Services
- VectorVest OnLine
- VectorVest Options Analyzer
- VectorVest ProGraphics v6.0
- VectorVest ProTrader 7
- VectorVest RealTime Derby Tool
- VectorVest Simulator
- VectorVest Variator
- VectorVest Watchdog
- StockCharts.com, Inc.
- Candle Patterns
- Candlestick Charting Explained
- Intermarket Technical Analysis
- John Murphy on Chart Analysis
- John Murphy's Chart Pattern Recognition
- John Murphy's Market Message
- MurphyExplainsMarketAnalysis-Intermarket Analysis
- MurphyExplainsMarketAnalysis-Visual Analysis
- StockCharts.com
- Technical Analysis of the Financial Markets
- The Visual Investor
